
Kindergarten students develop essential data interpretation skills by practicing reading graphs and tally charts, which enhances their ability to collect and organize information visually. Engaging activities improve pattern recognition and numerical understanding through simple comparisons and counting. Explore our collection of worksheets designed to make learning fun and effective for young learners.
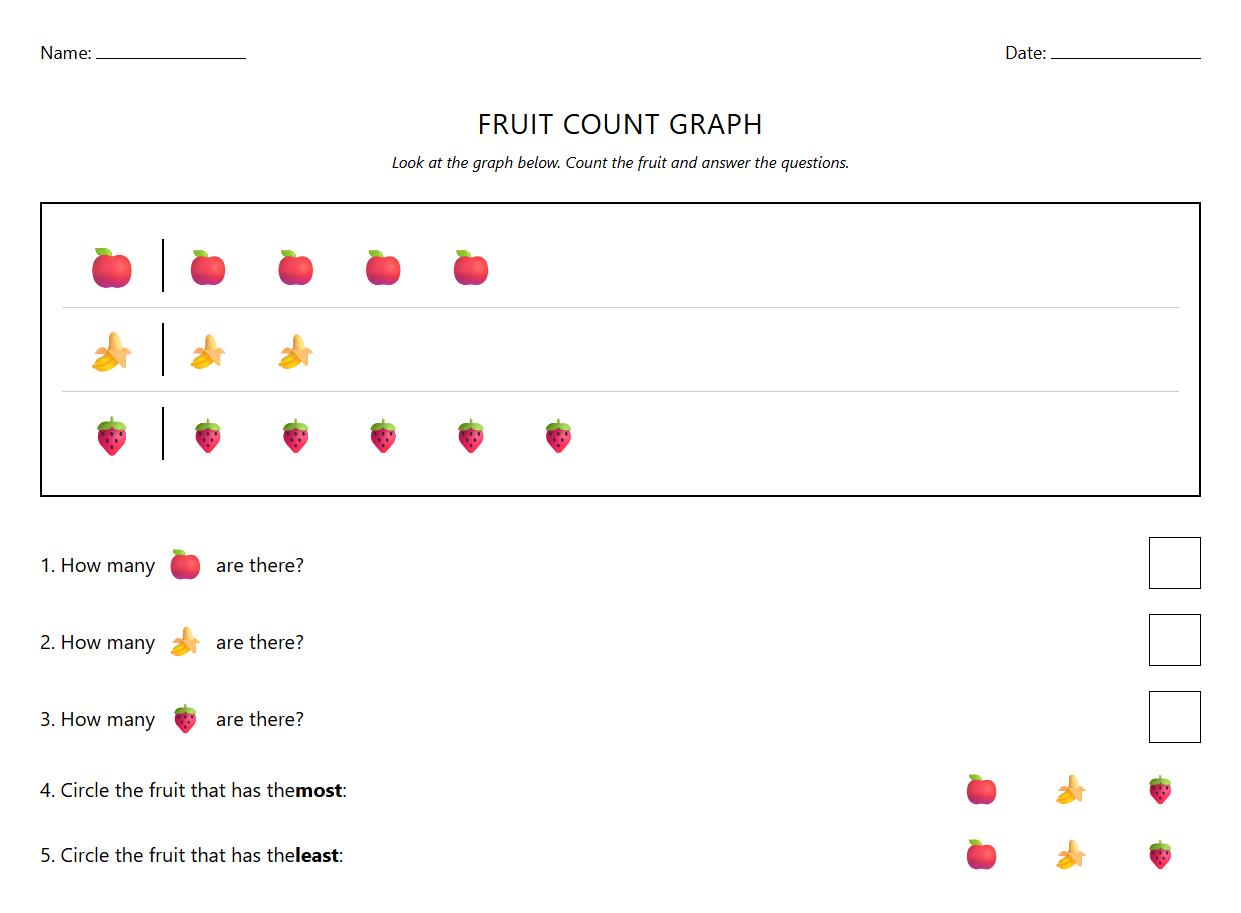
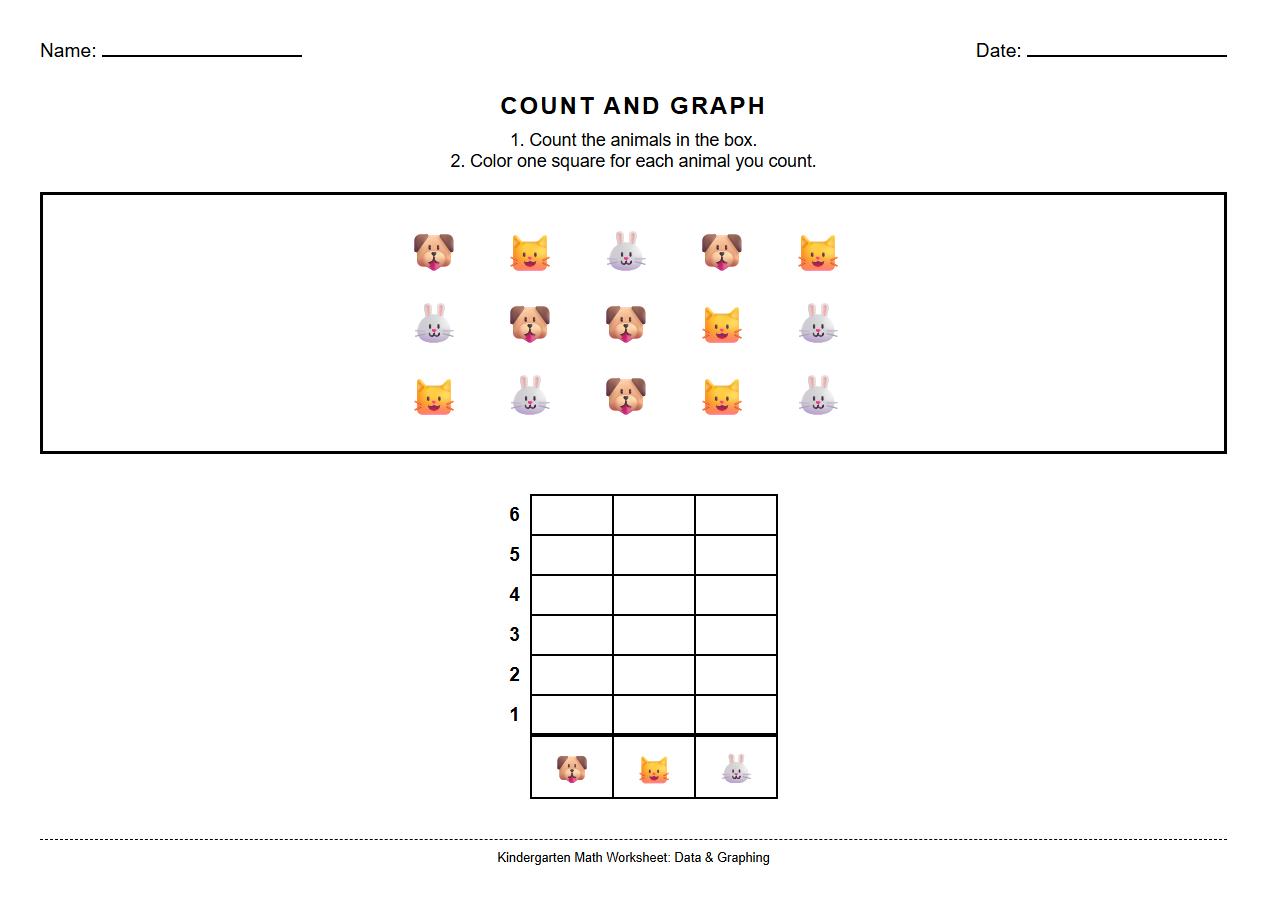
Bar Graph Interpretation Worksheet for Kindergarten


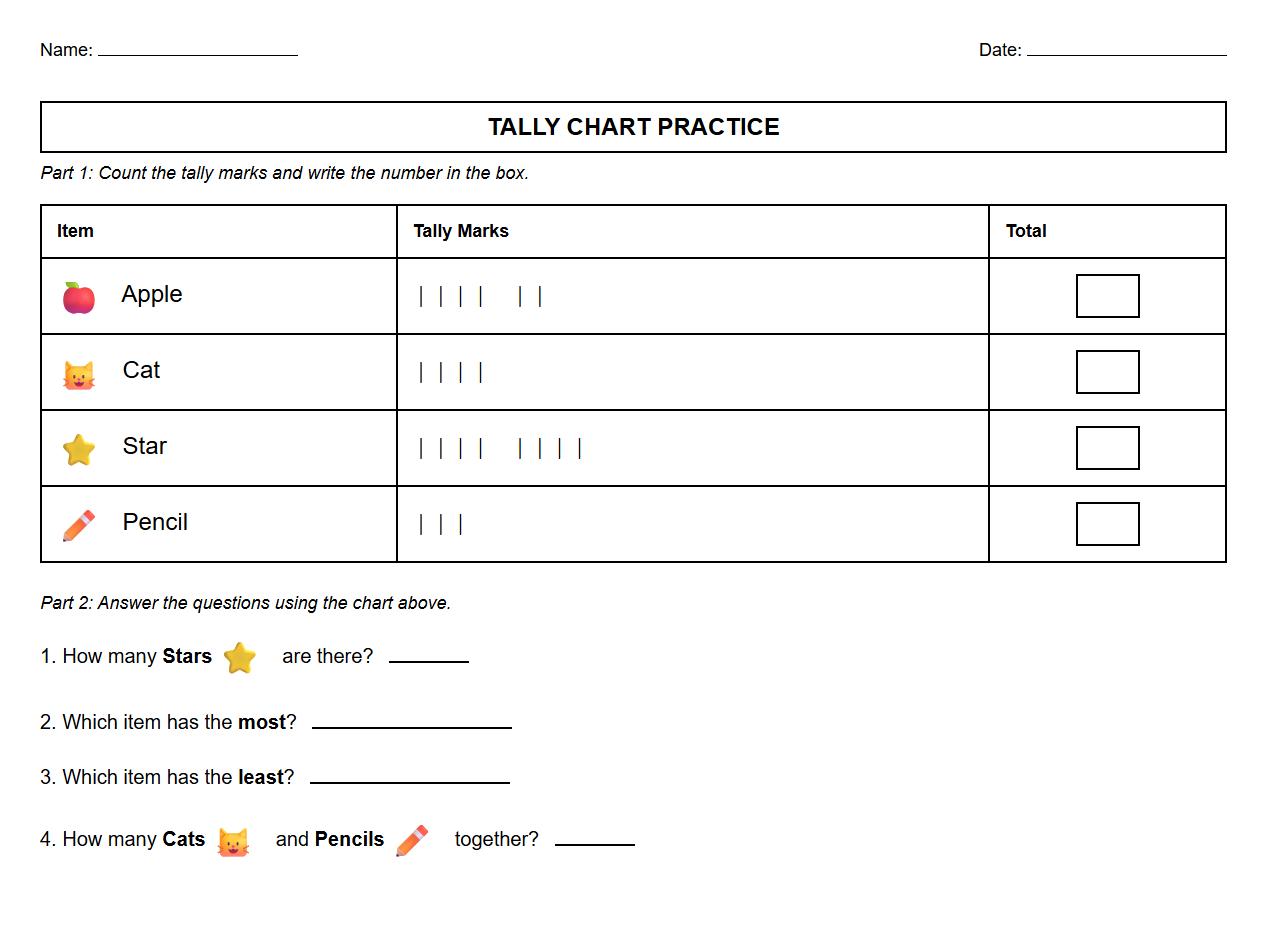
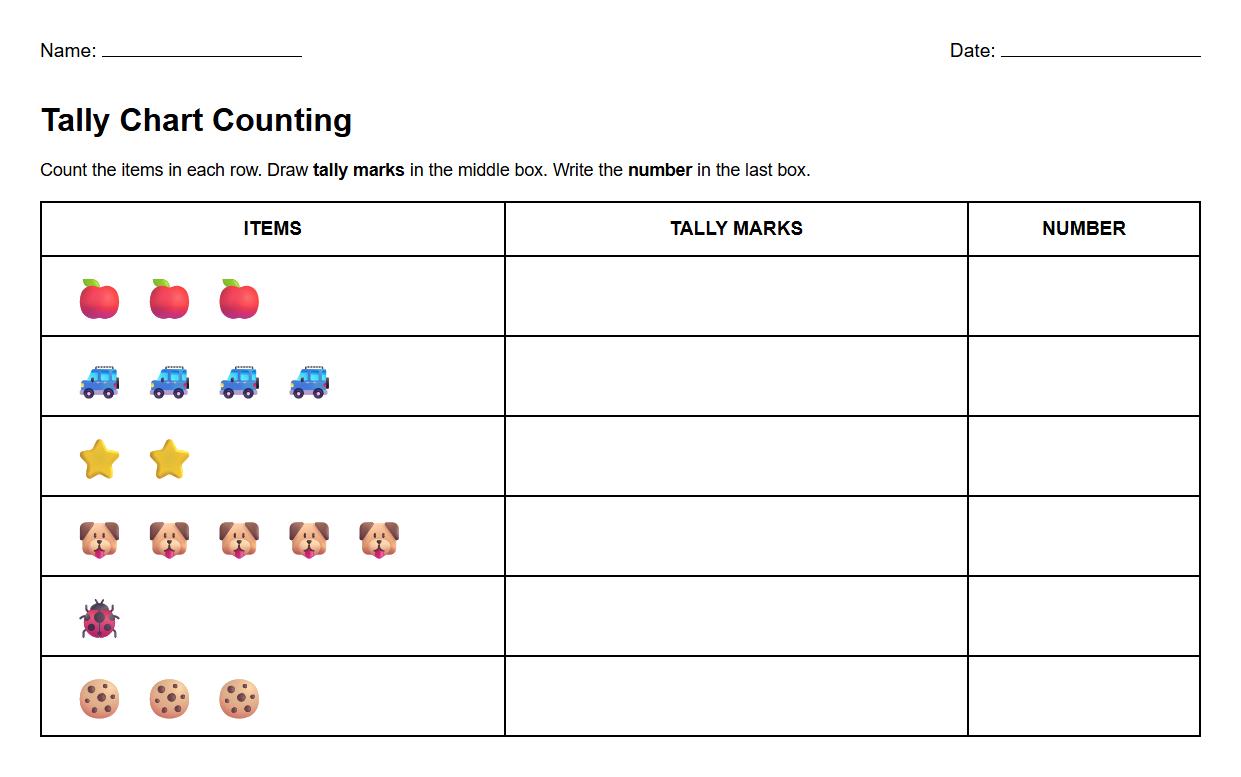
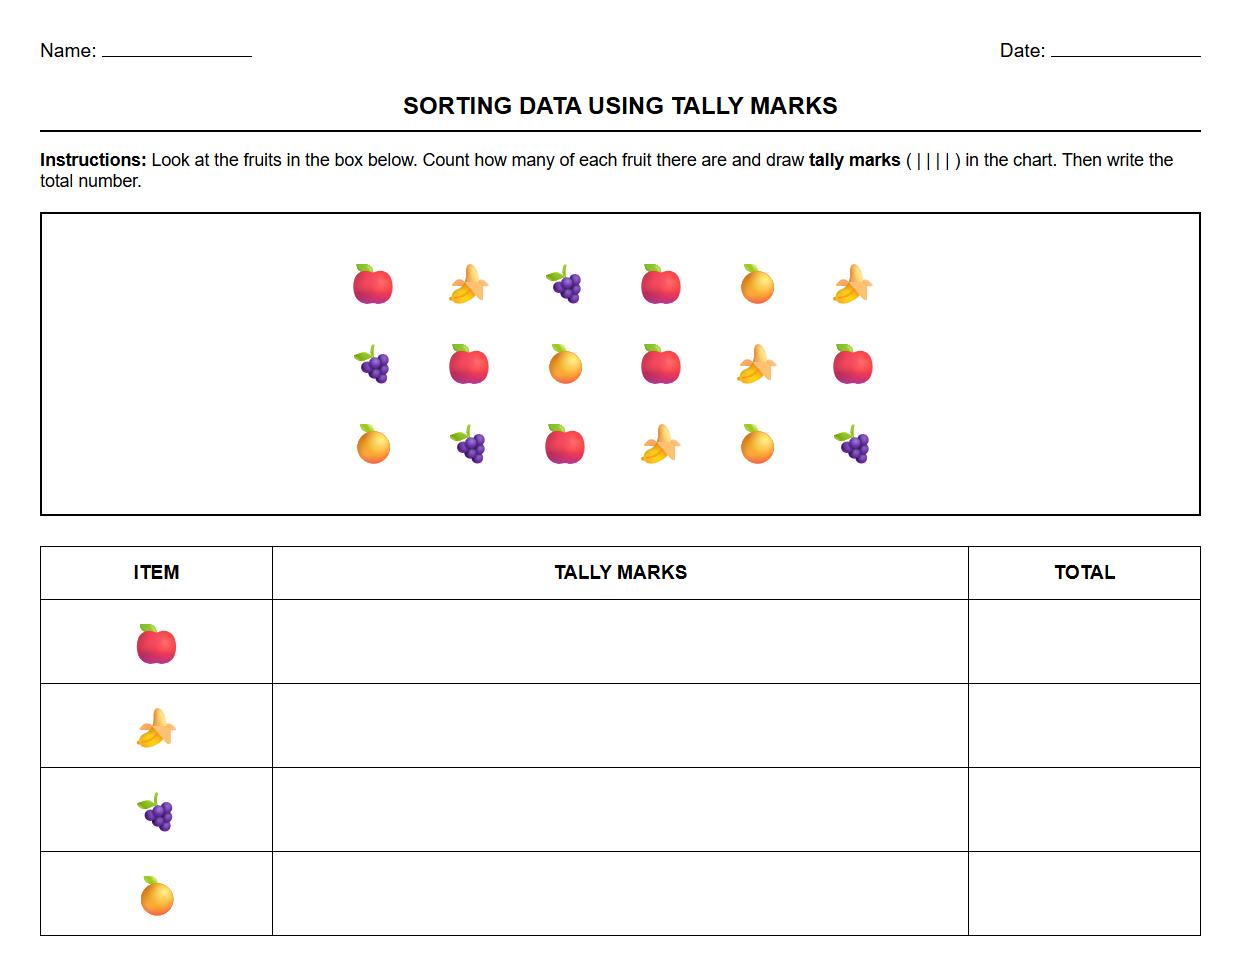
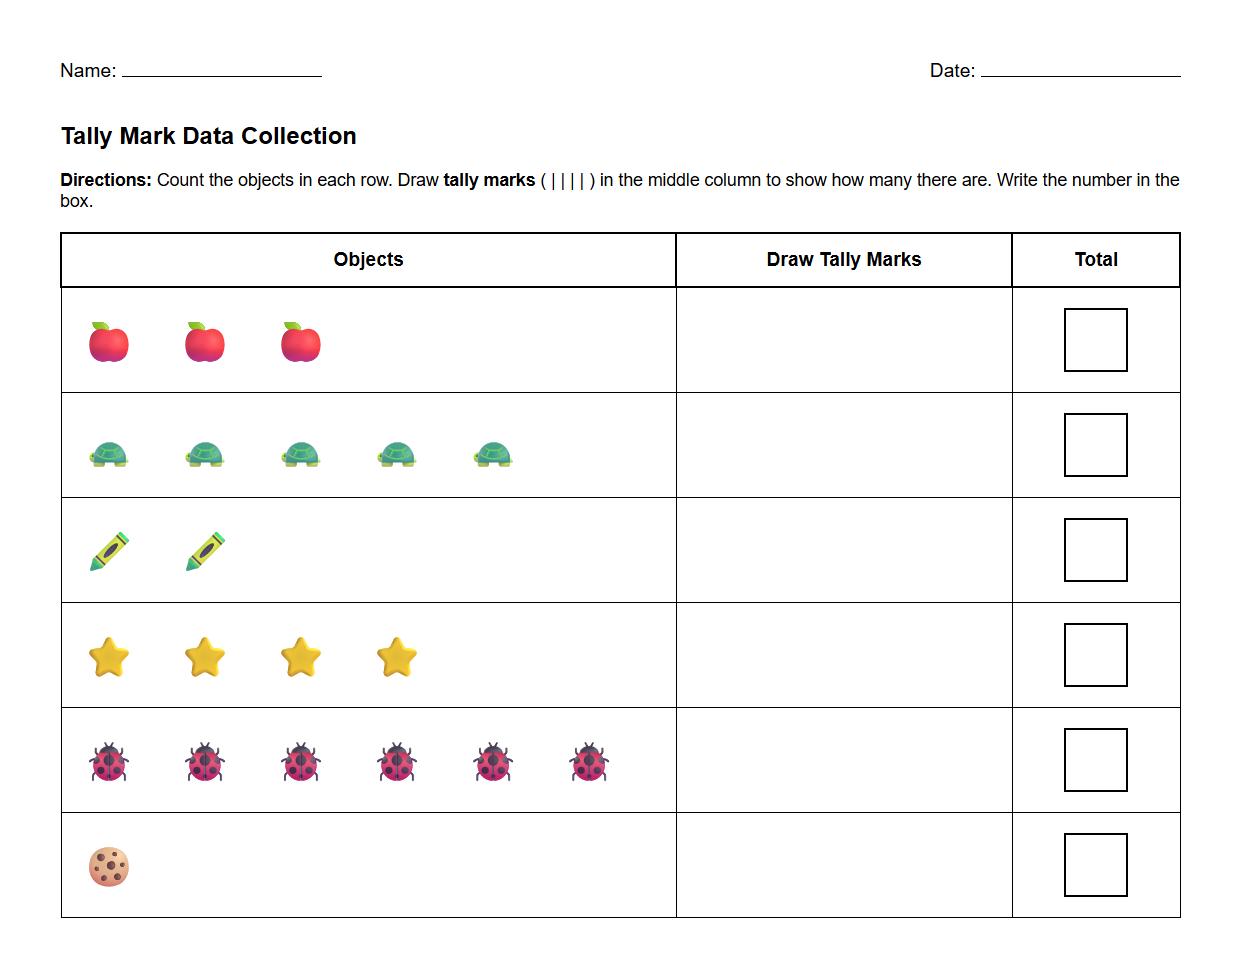
Tally Chart Counting Exercise for Early Readers

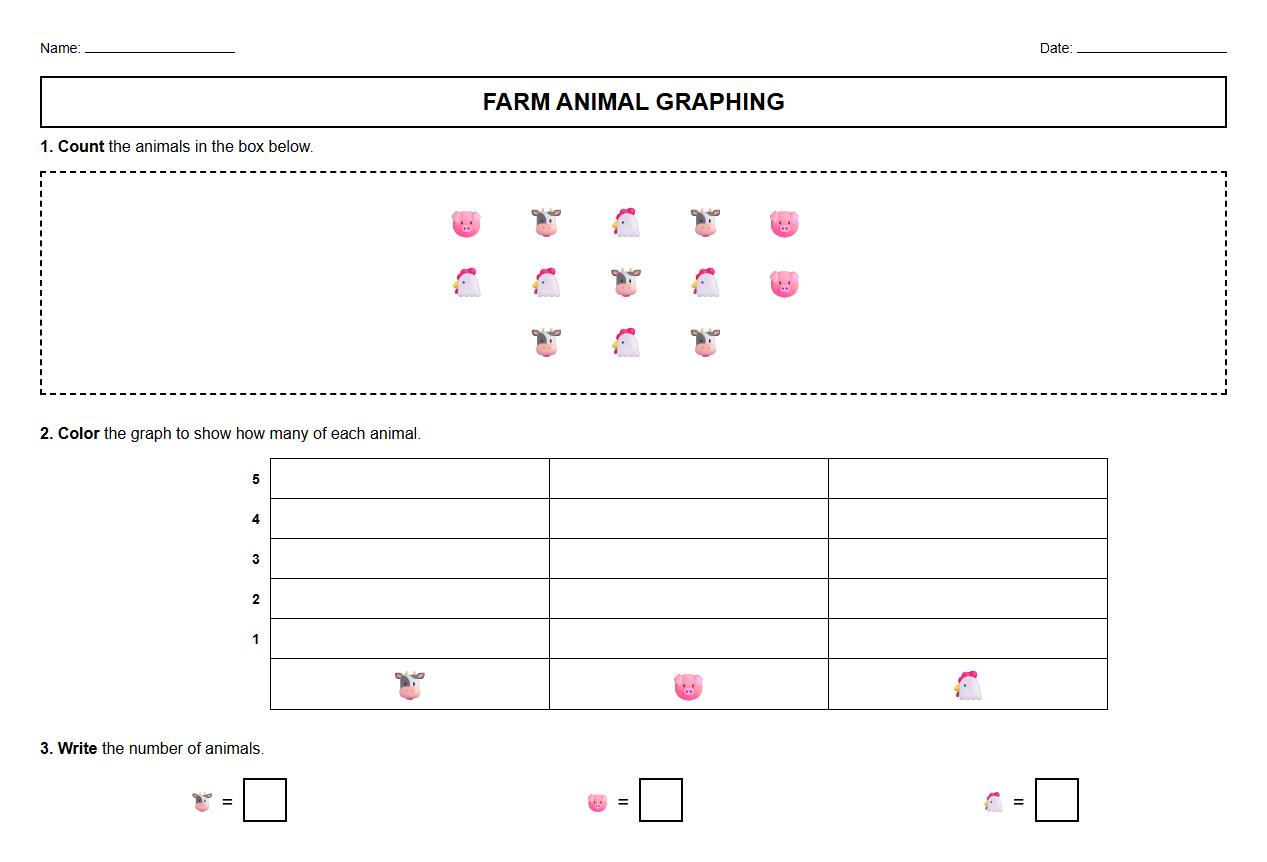
Picture Graph Comprehension Sheet for Kindergarten

Sorting Data Using Tally Marks Activity

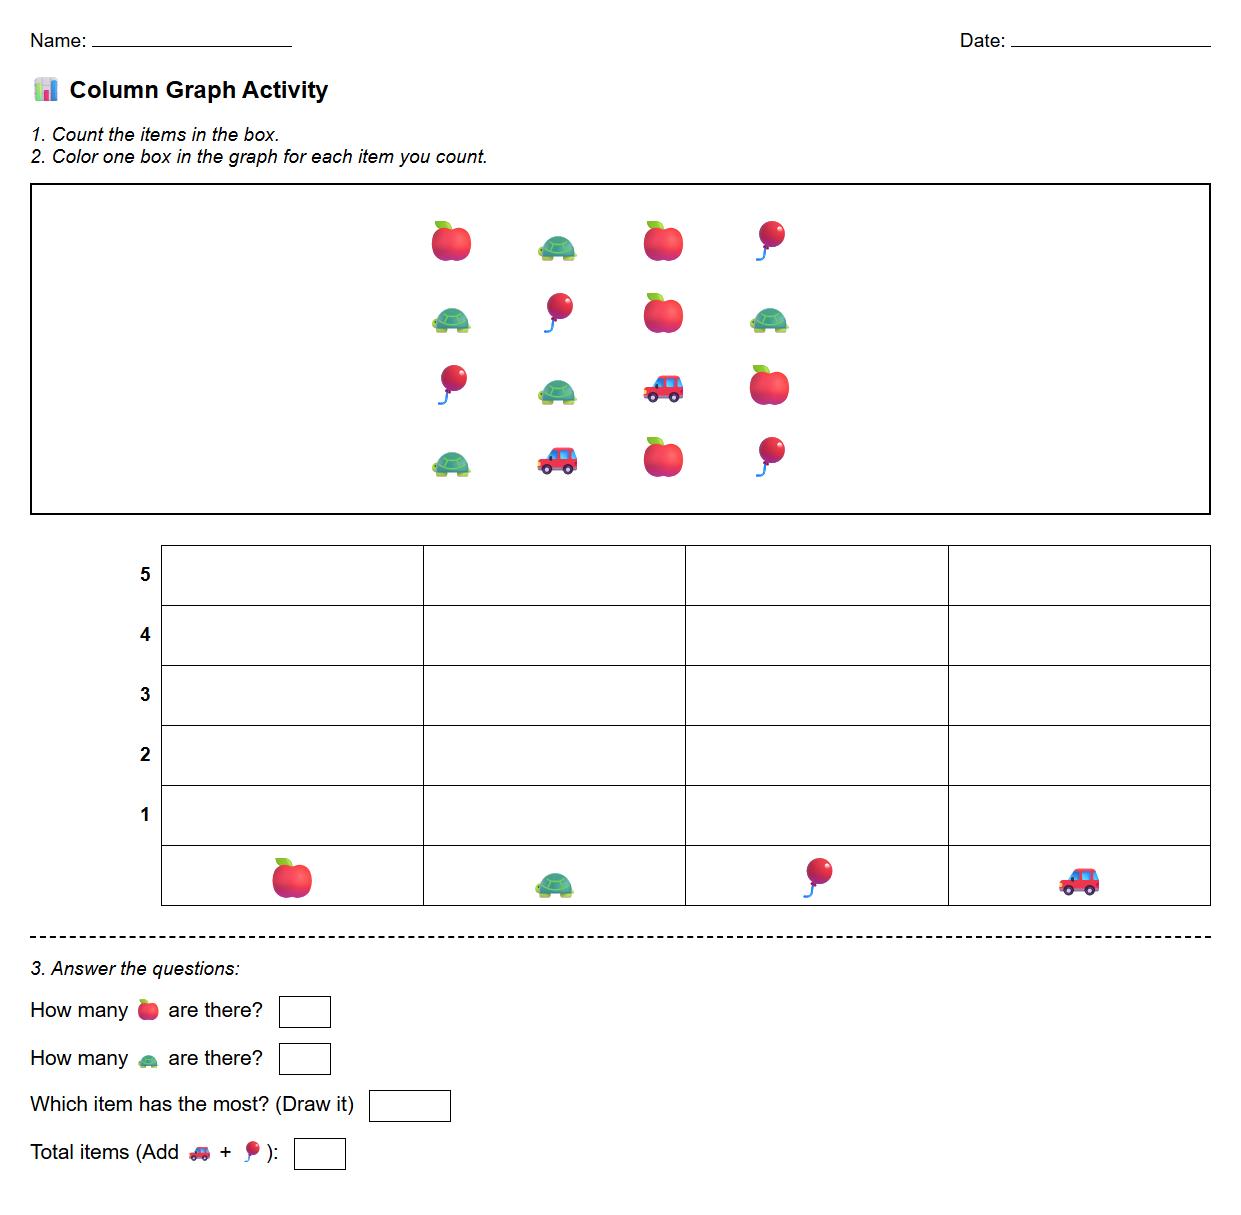
Column Graph Reading Practice for Young Learners

Matching Items to Tally Chart Worksheet
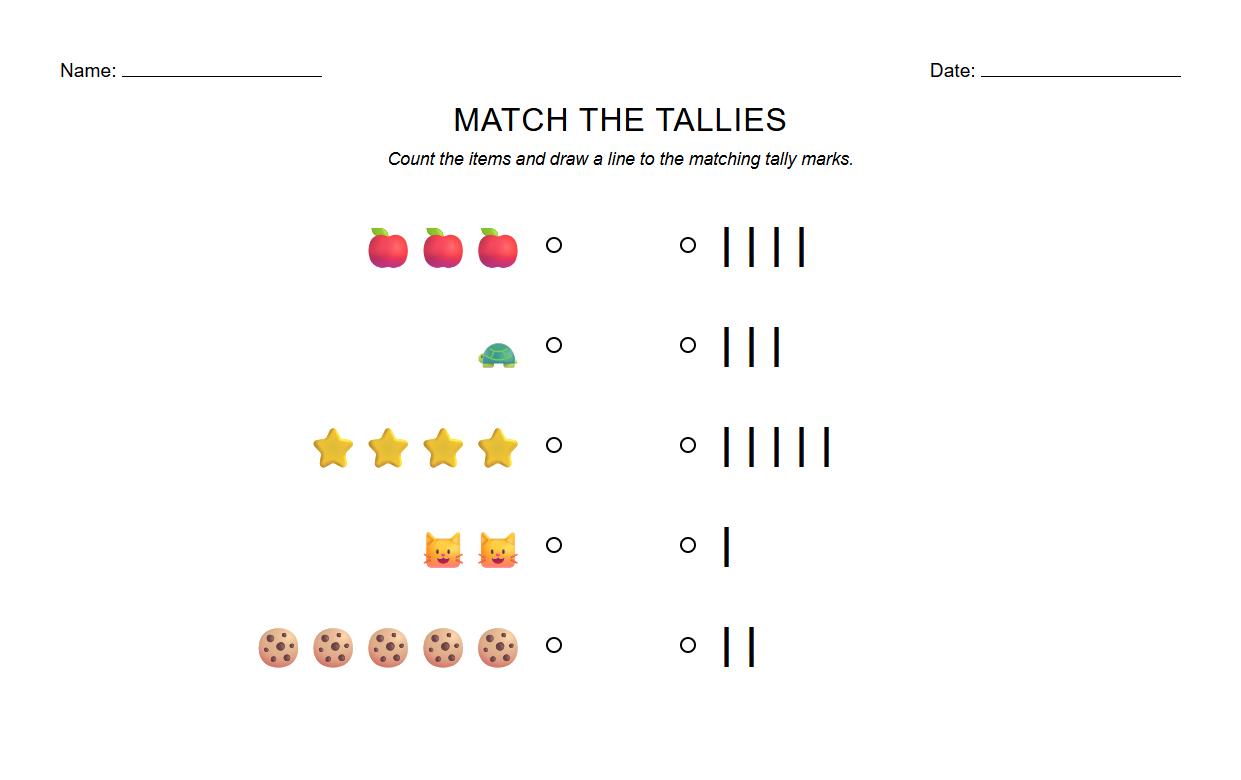

Simple Data Collection Using Tally Marks Sheet

Creating Bar Graphs from Data Activity

Reading and Comparing Picture Graphs Worksheet
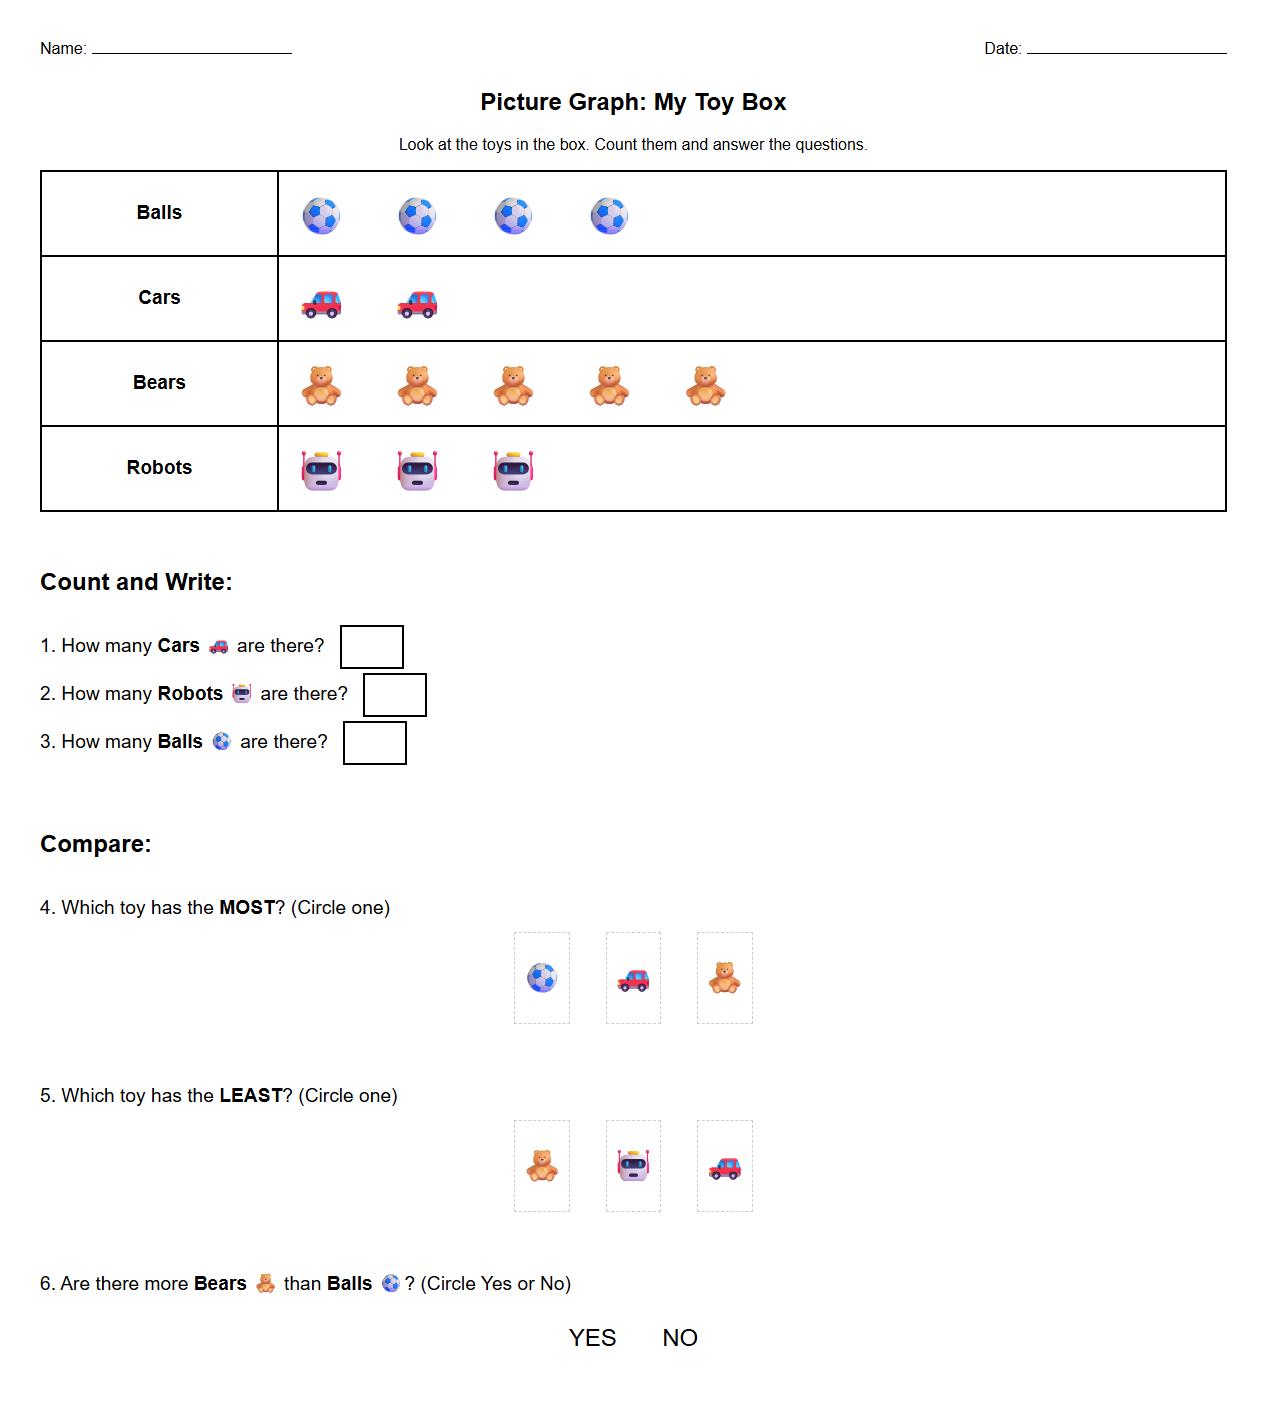

Answering Questions from Tally Chart Practice Sheet