
Kindergarten students develop foundational data interpretation skills by using tally marks and picture graphs. These exercises enhance counting, sorting, and visual representation abilities essential for early math proficiency. Explore our collection of engaging worksheets to support your child's learning journey in tally marks and picture graph skills.
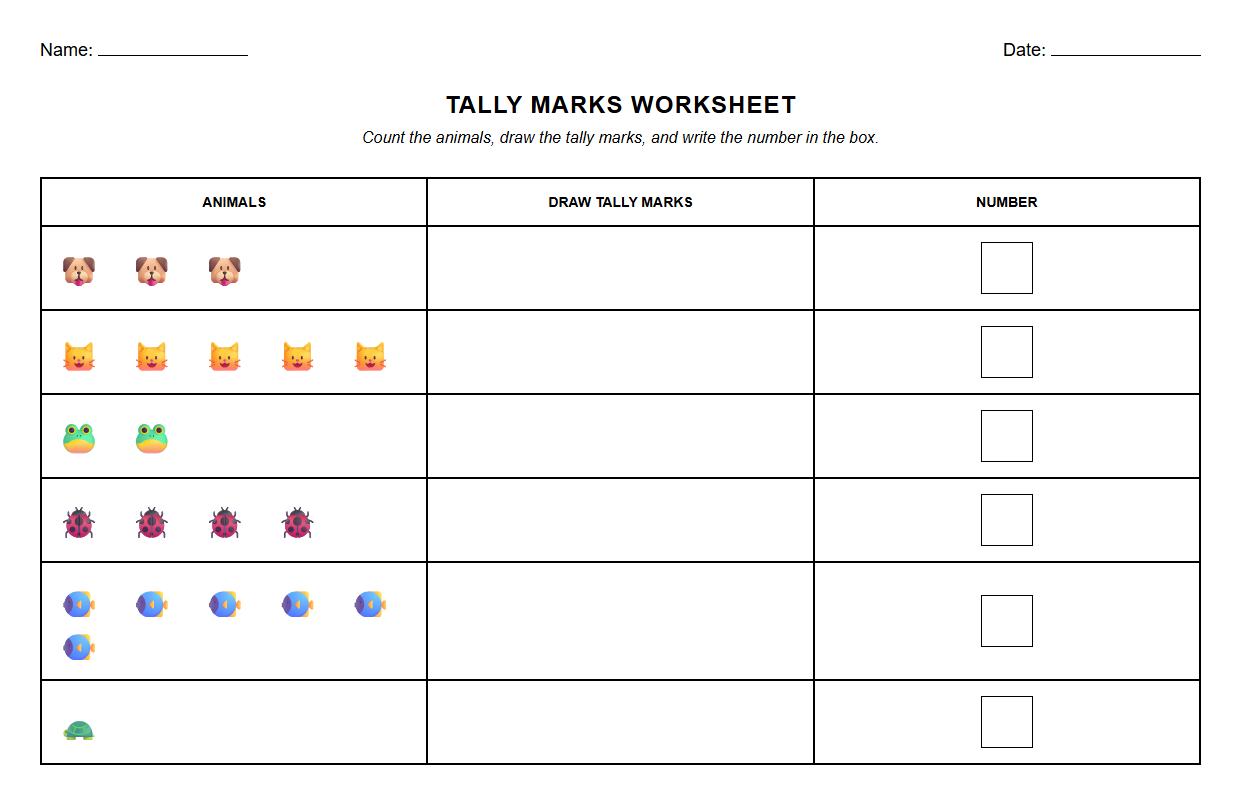
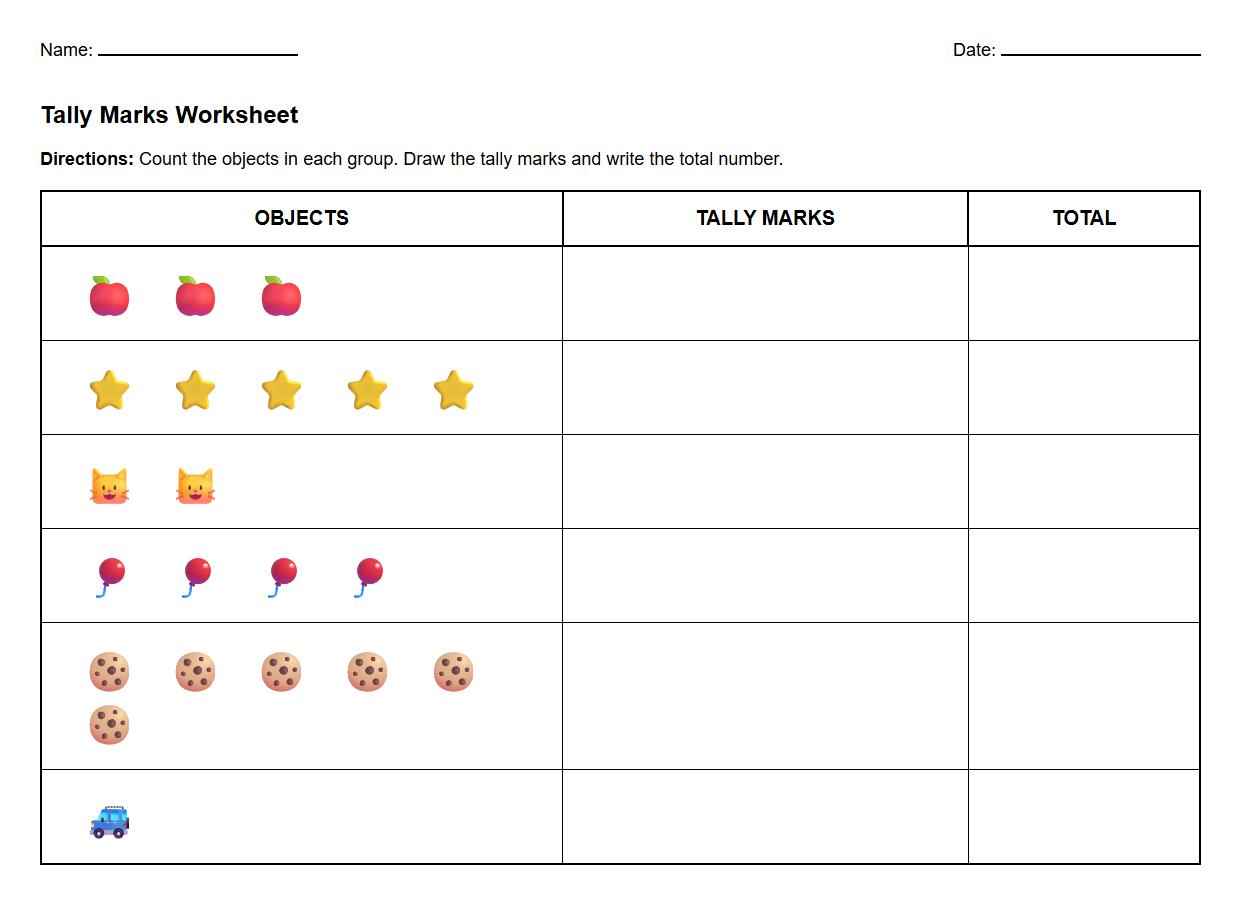
Tally Marks Counting with Animal Images Worksheet


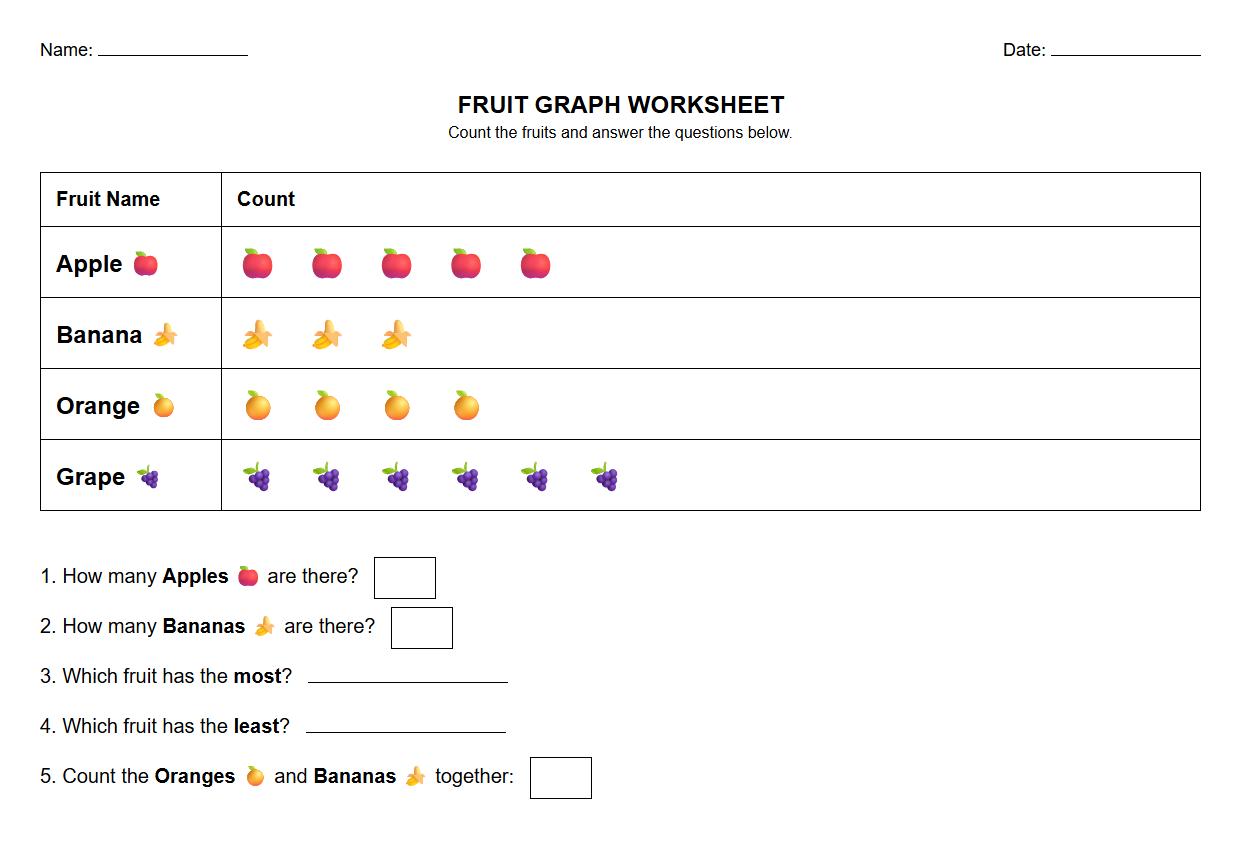
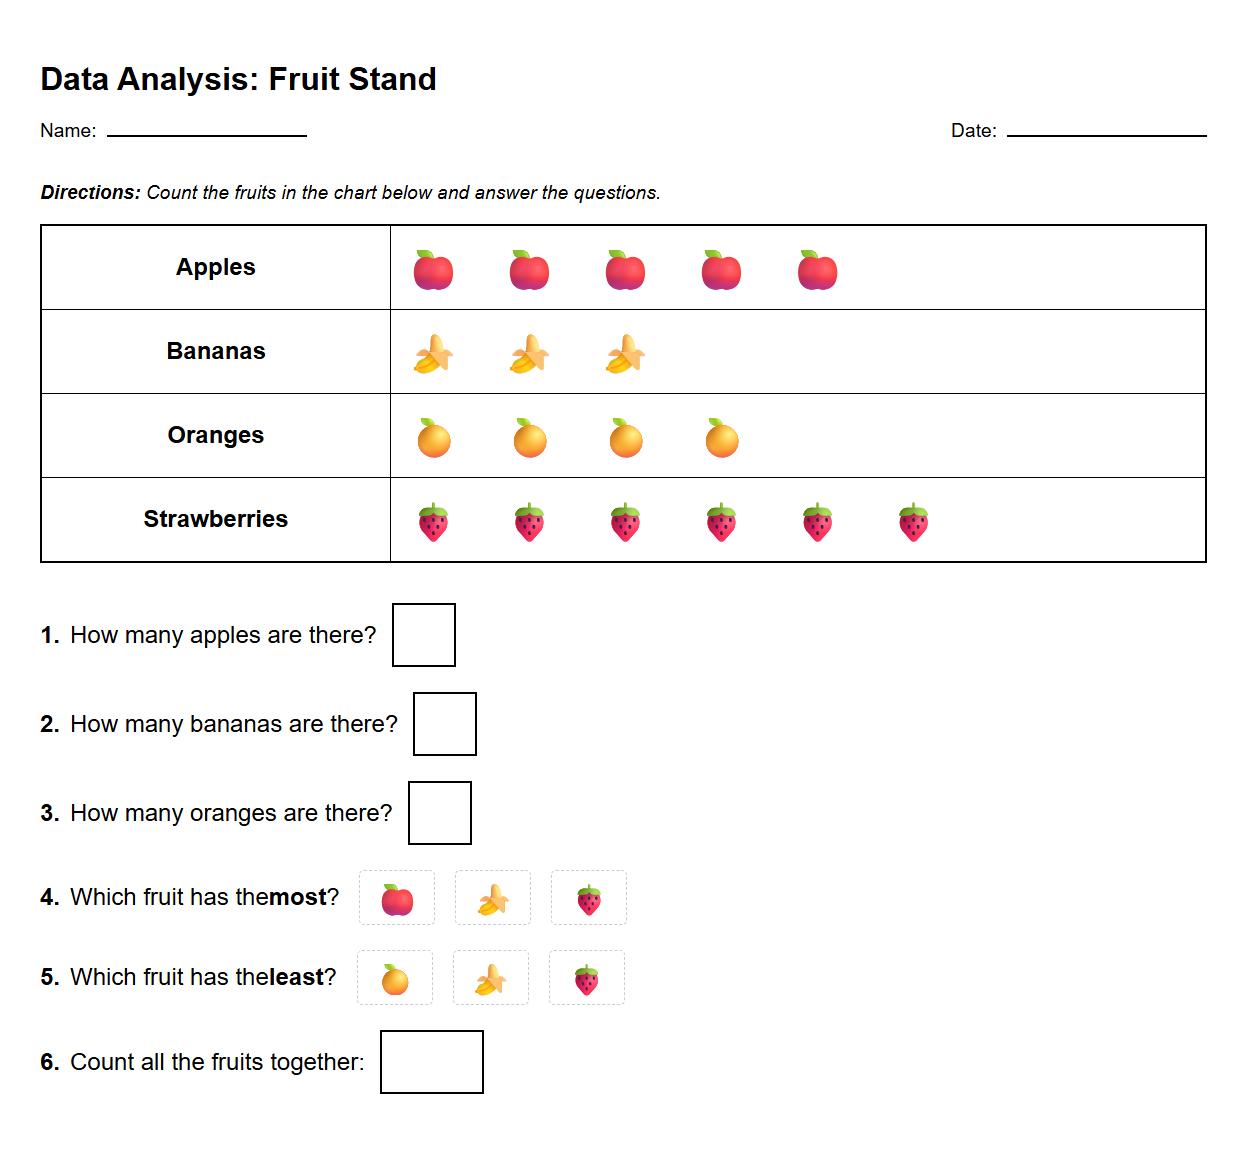
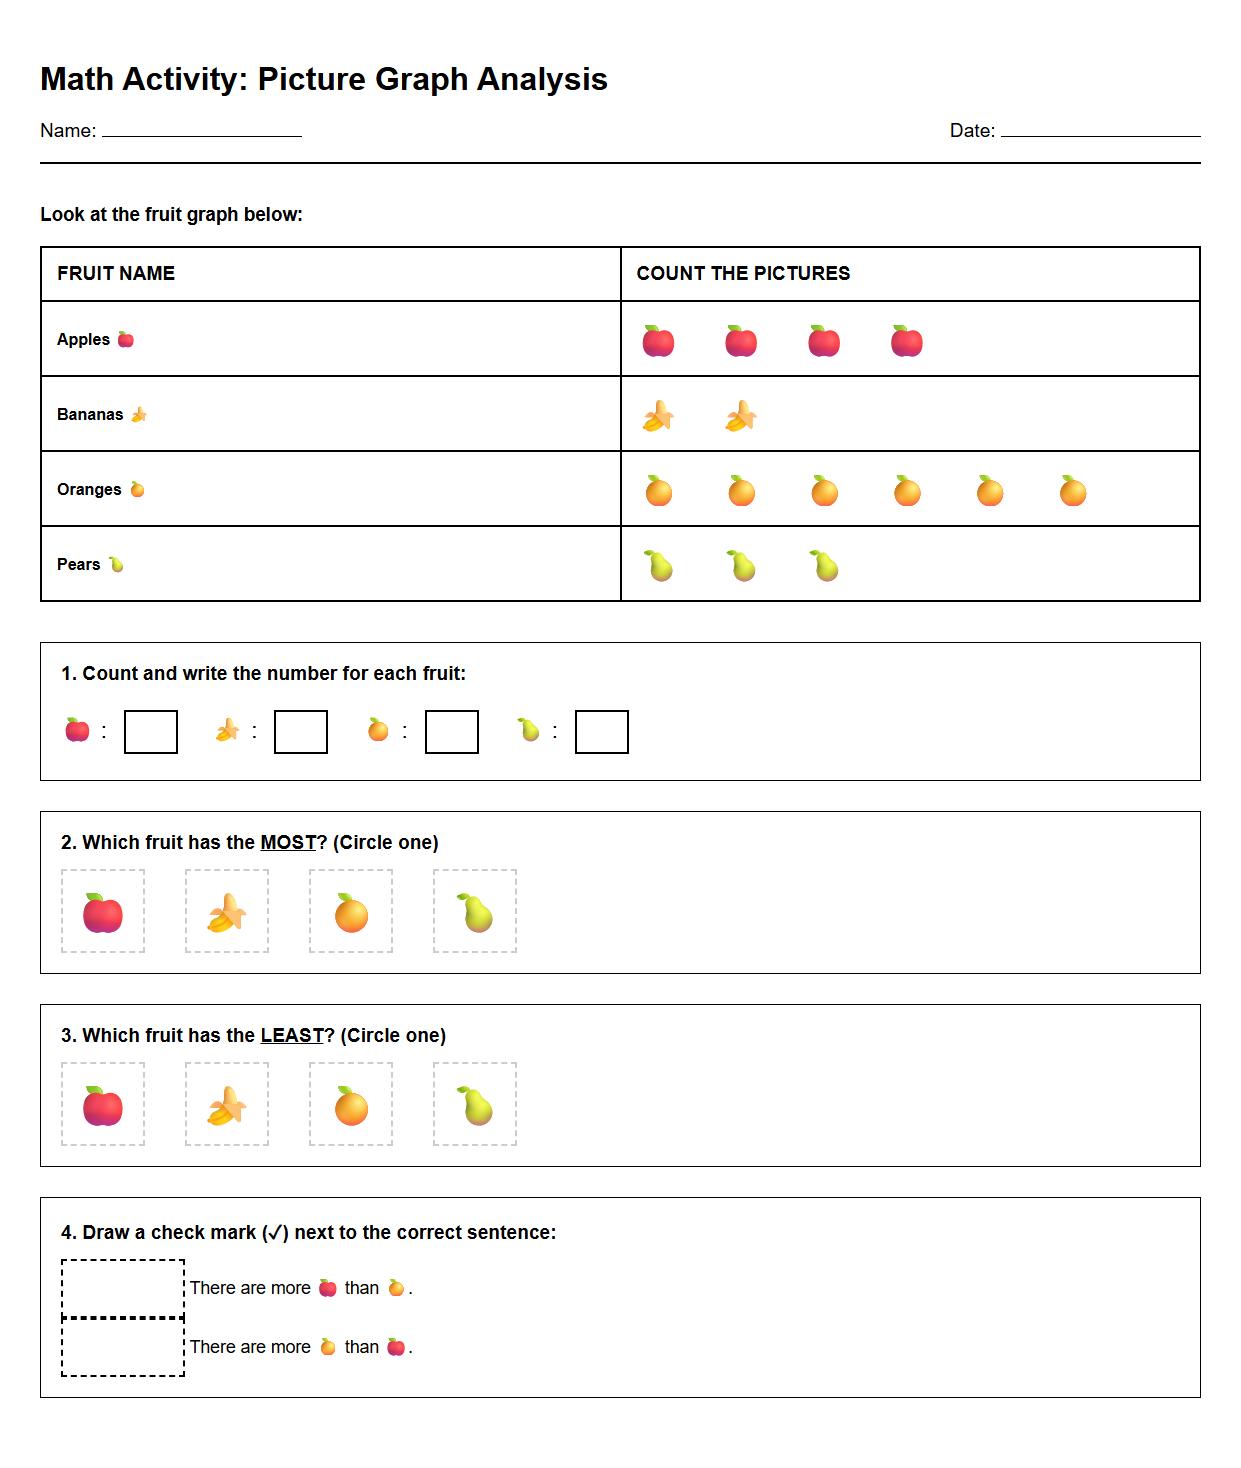
Picture Graph Interpretation with Fruits Worksheet

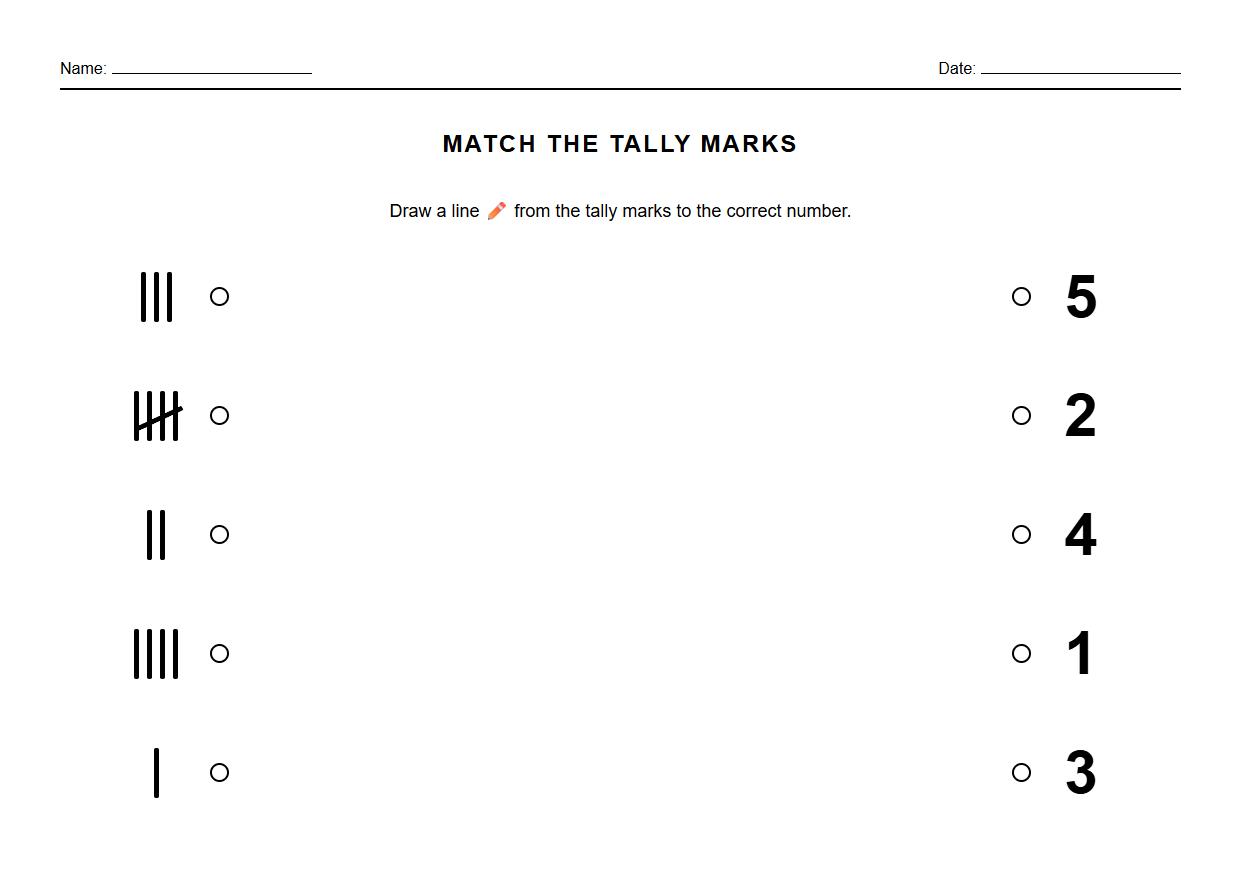
Match Tally Marks to Correct Quantity Worksheet

Create Tally Marks for Given Object Groups Worksheet

Analyze Picture Graph Data and Answer Questions Worksheet

Tally Marks and Graphing with Transportation Icons Sheet
![]()
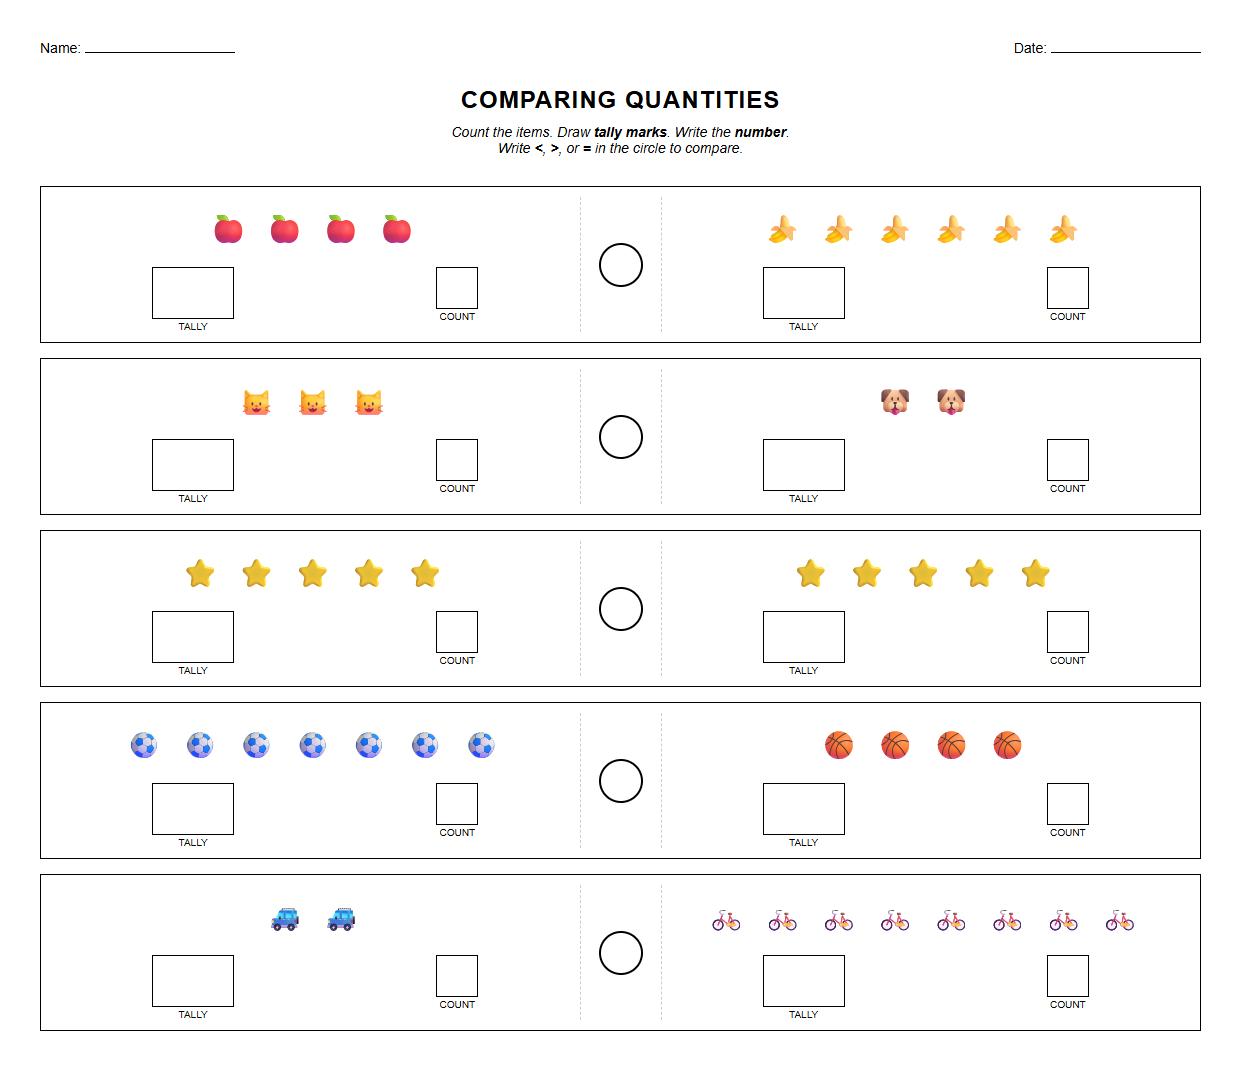
Compare Quantities using Tally Marks and Picture Charts Worksheet

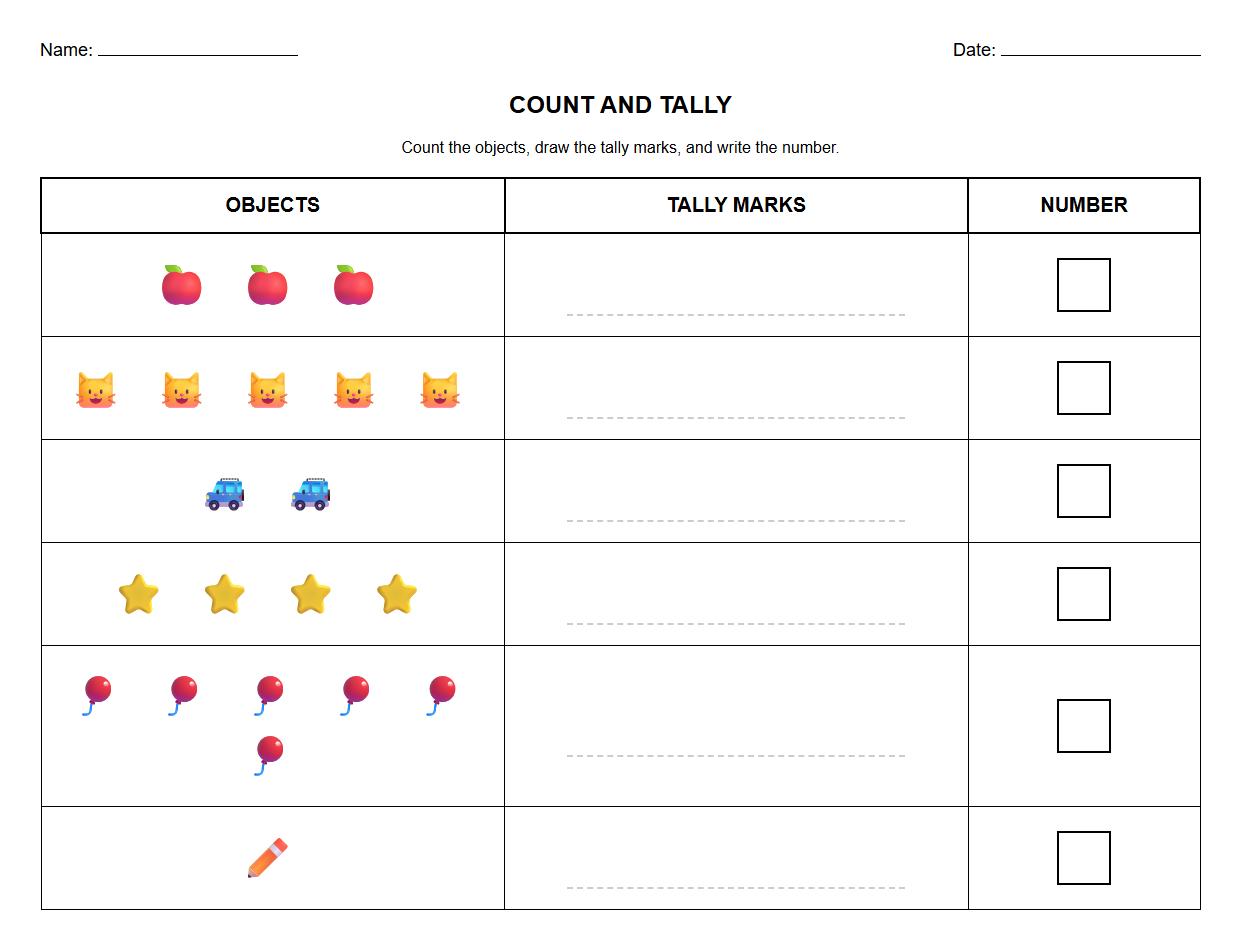
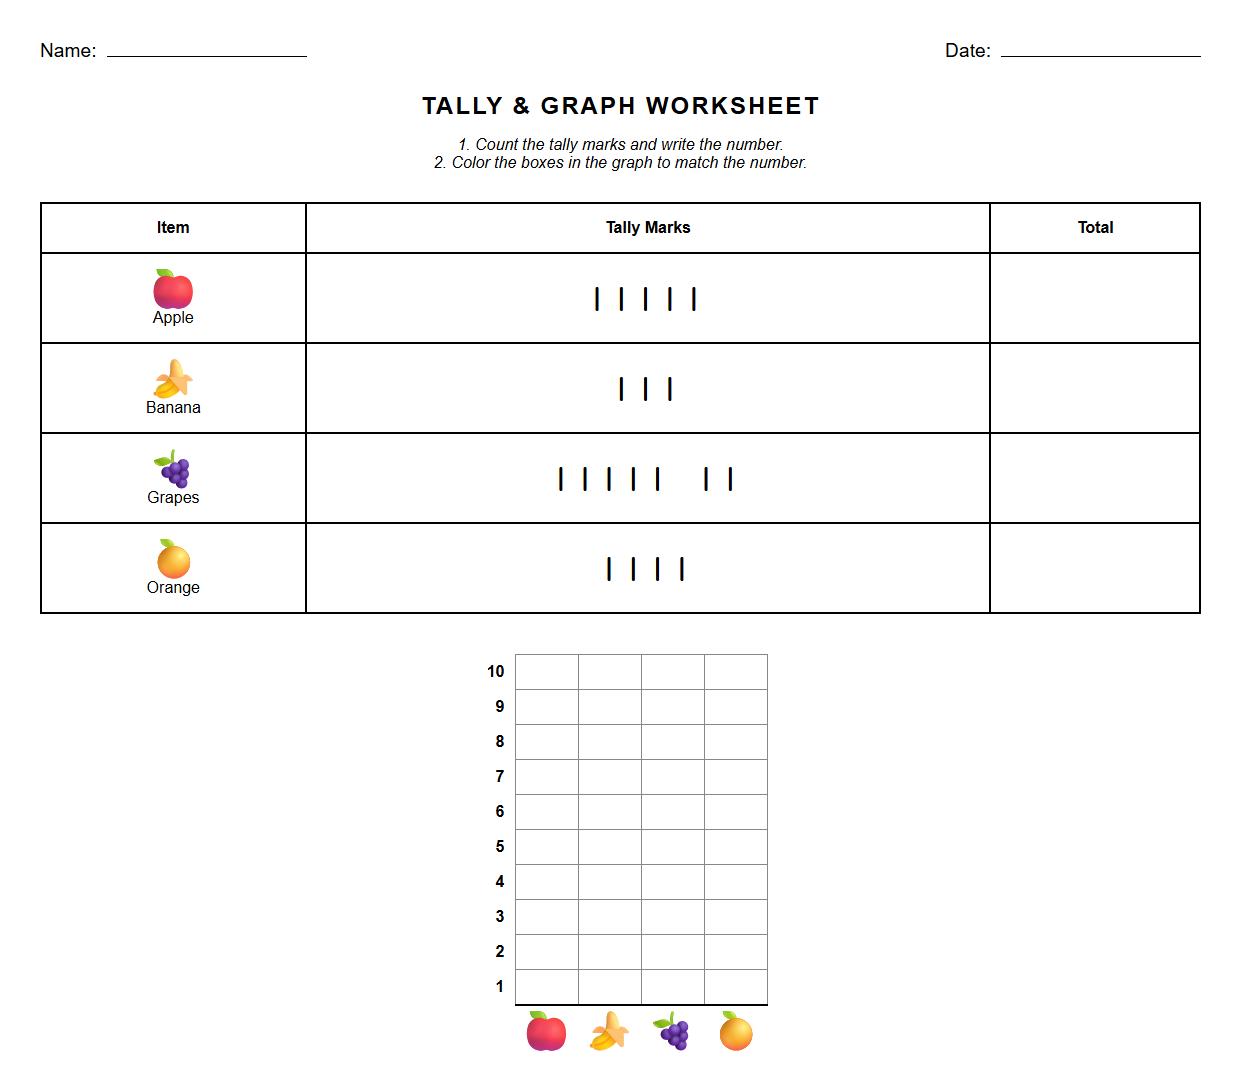
Fill in The Blank Tally Chart with Numbered Objects Worksheet

Bar Graph Construction from Collected Tally Data Worksheet

Identify Most and Least Using Picture Graph Analysis Sheet

 Sorting, Counting, and Graphing Worksheet for Kindergarten