
Tally marks help kids organize data by grouping counts in sets of five, making it easy to visualize quantities. Converting tally marks to bar graphs introduces children to data representation and interpretation skills. Explore our engaging worksheets to practice converting tally marks into colorful bar graphs.
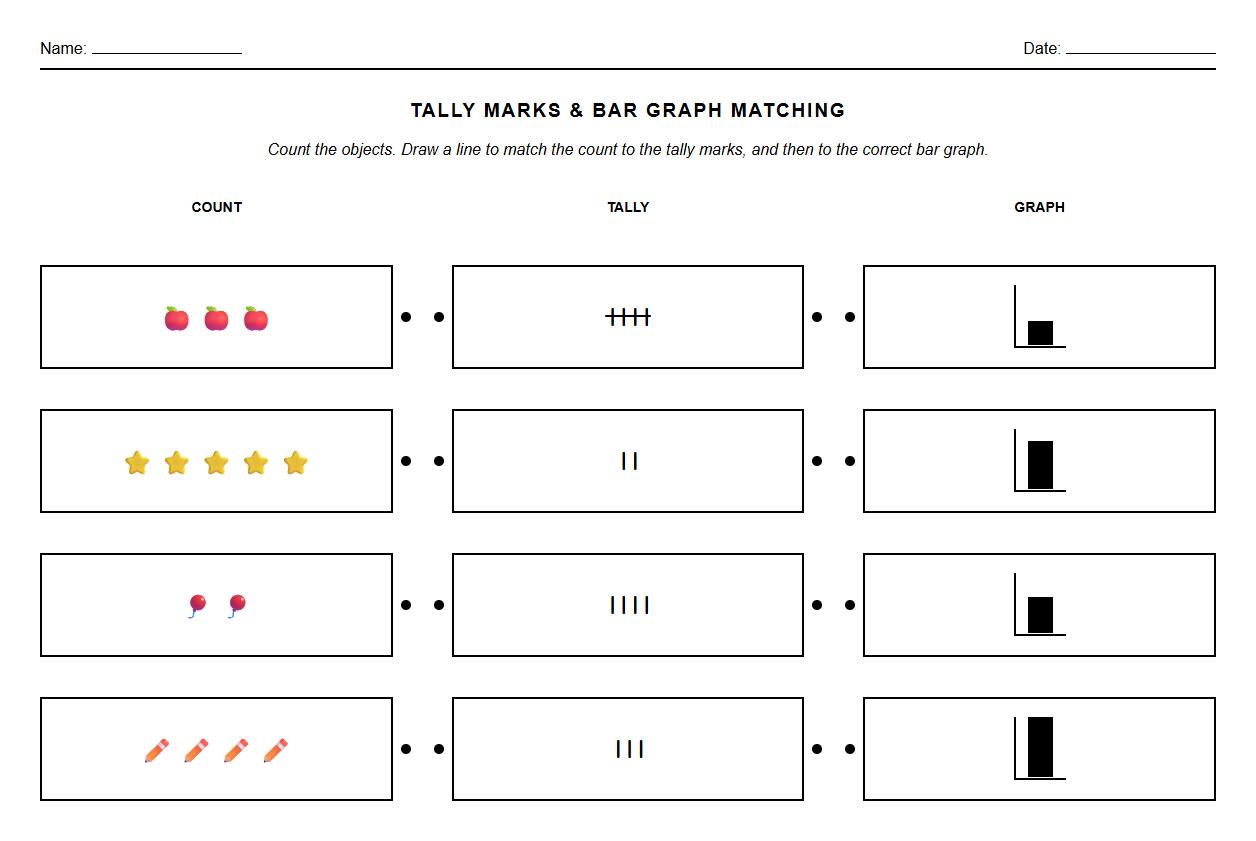
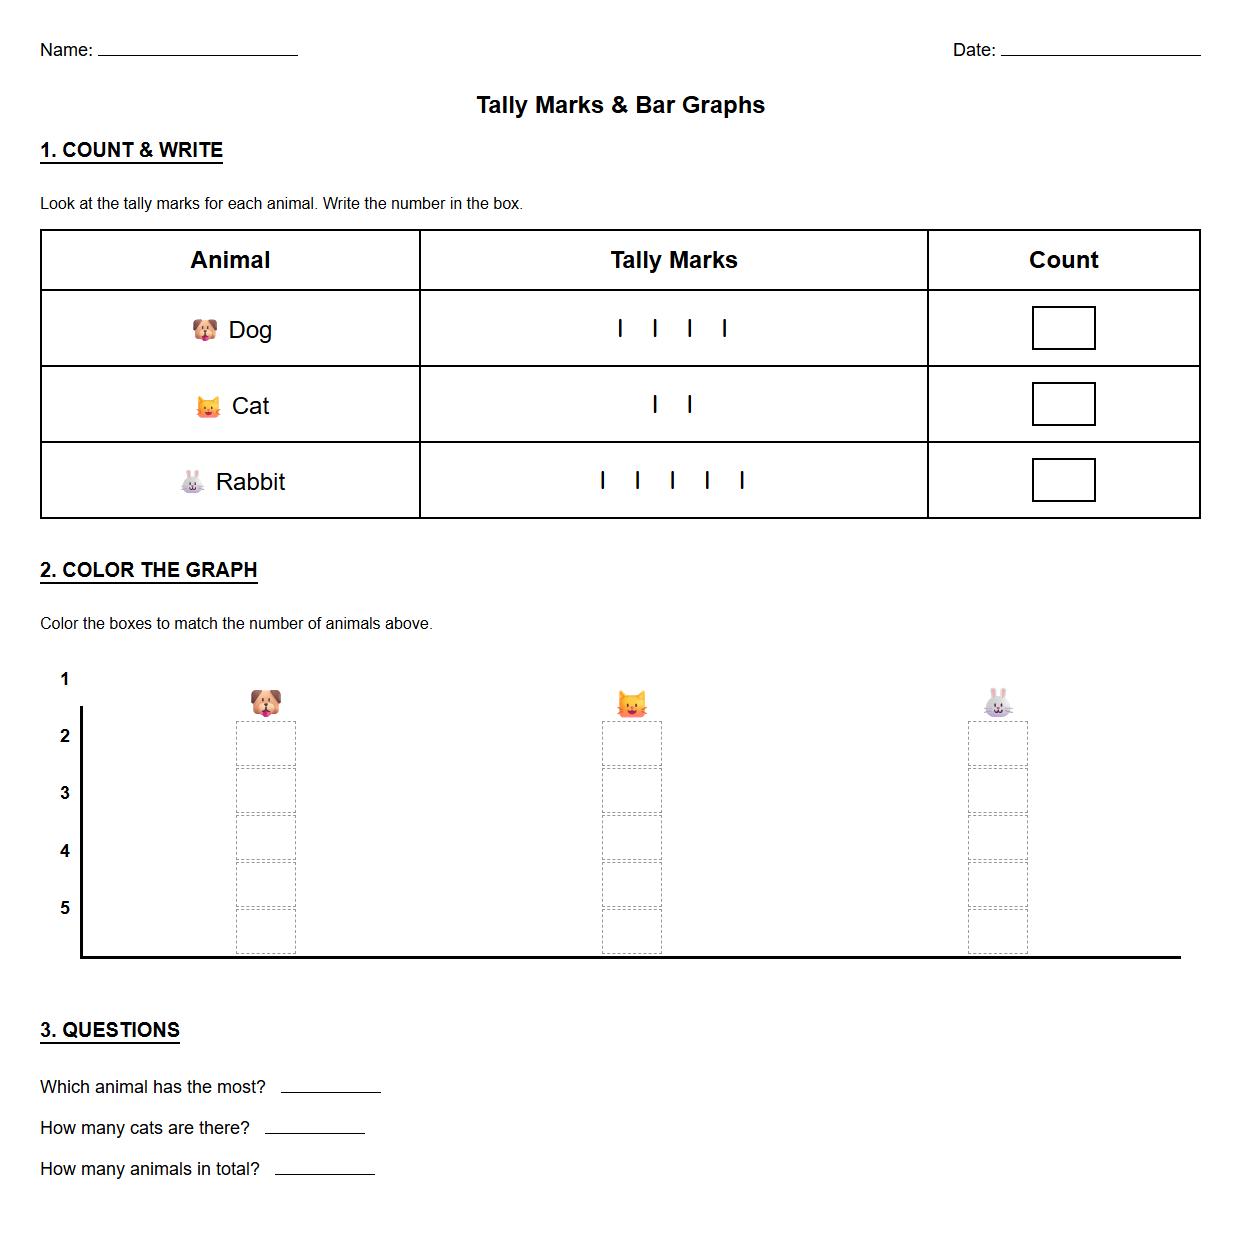
Tally Marks and Bar Graph Matching Worksheet


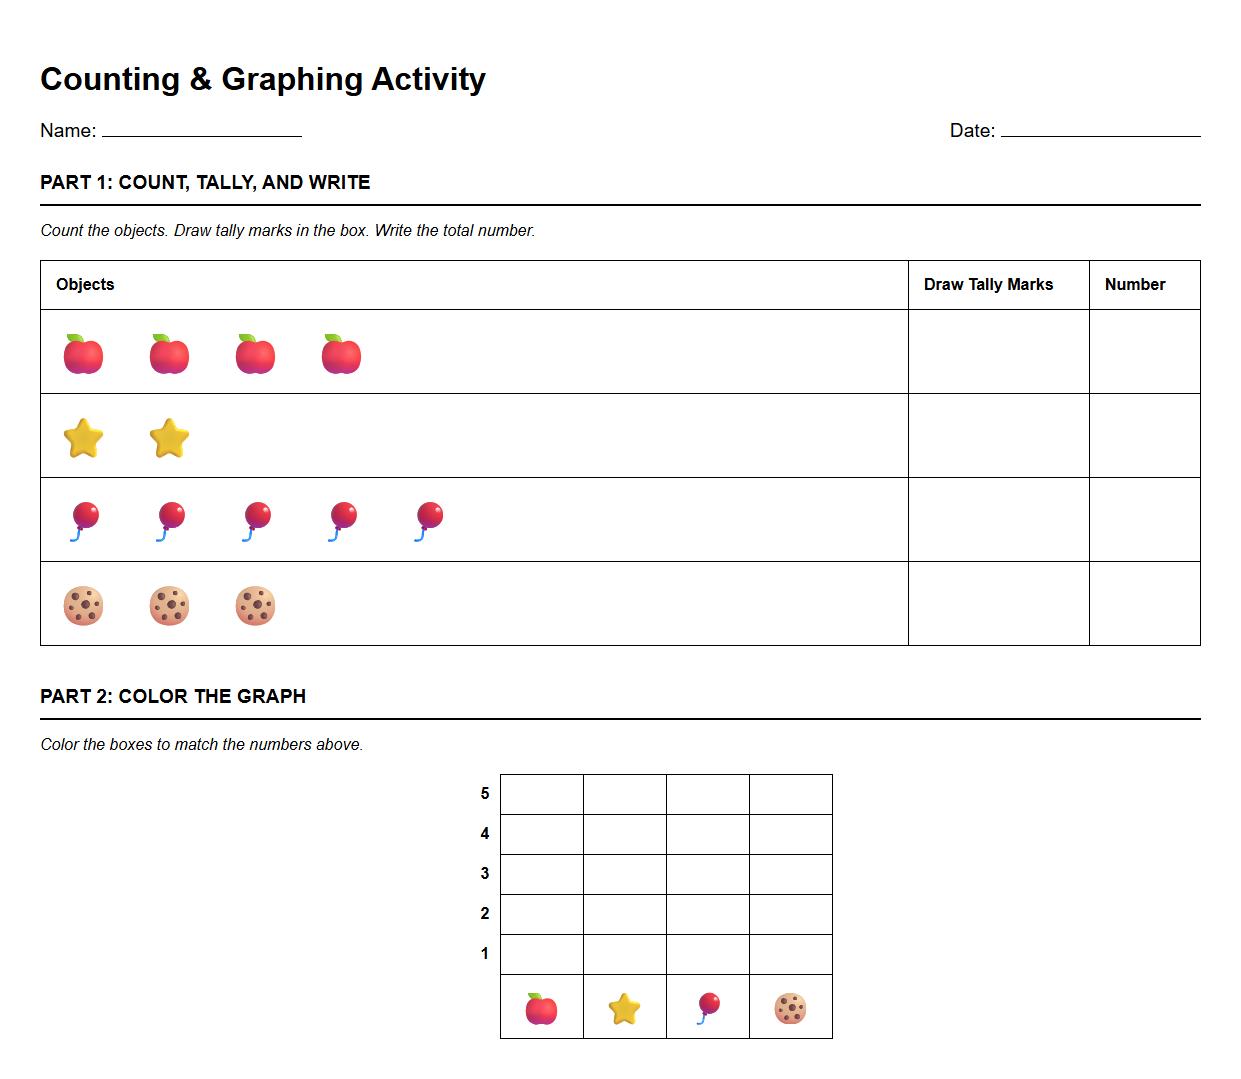
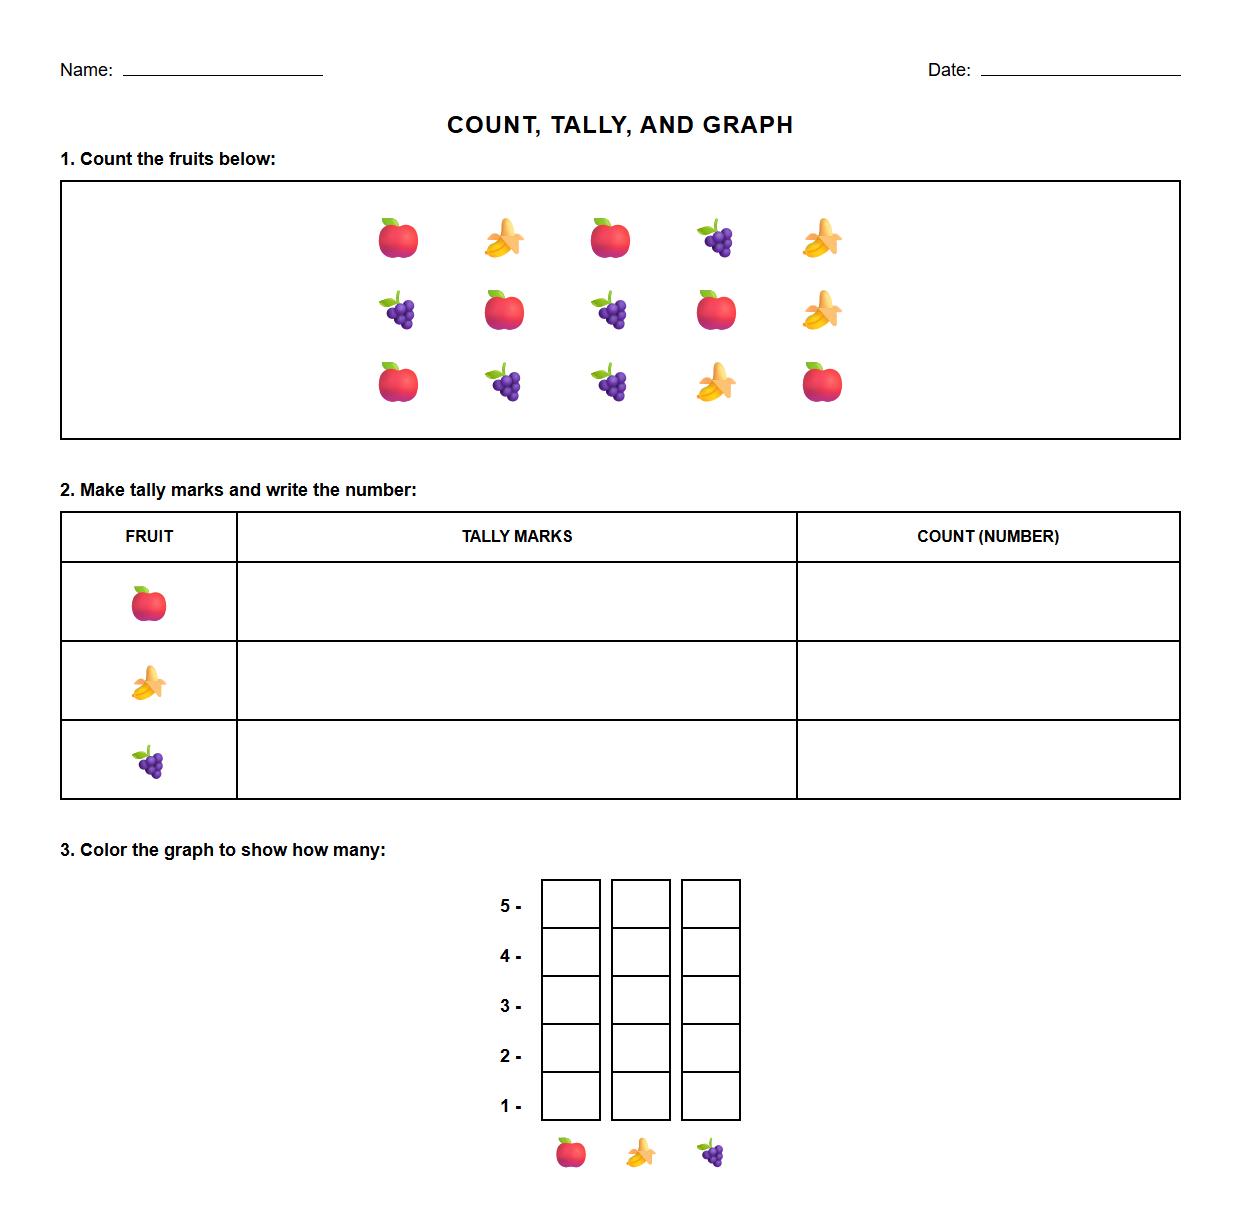
Counting Objects with Tally Marks and Bar Graph Representation

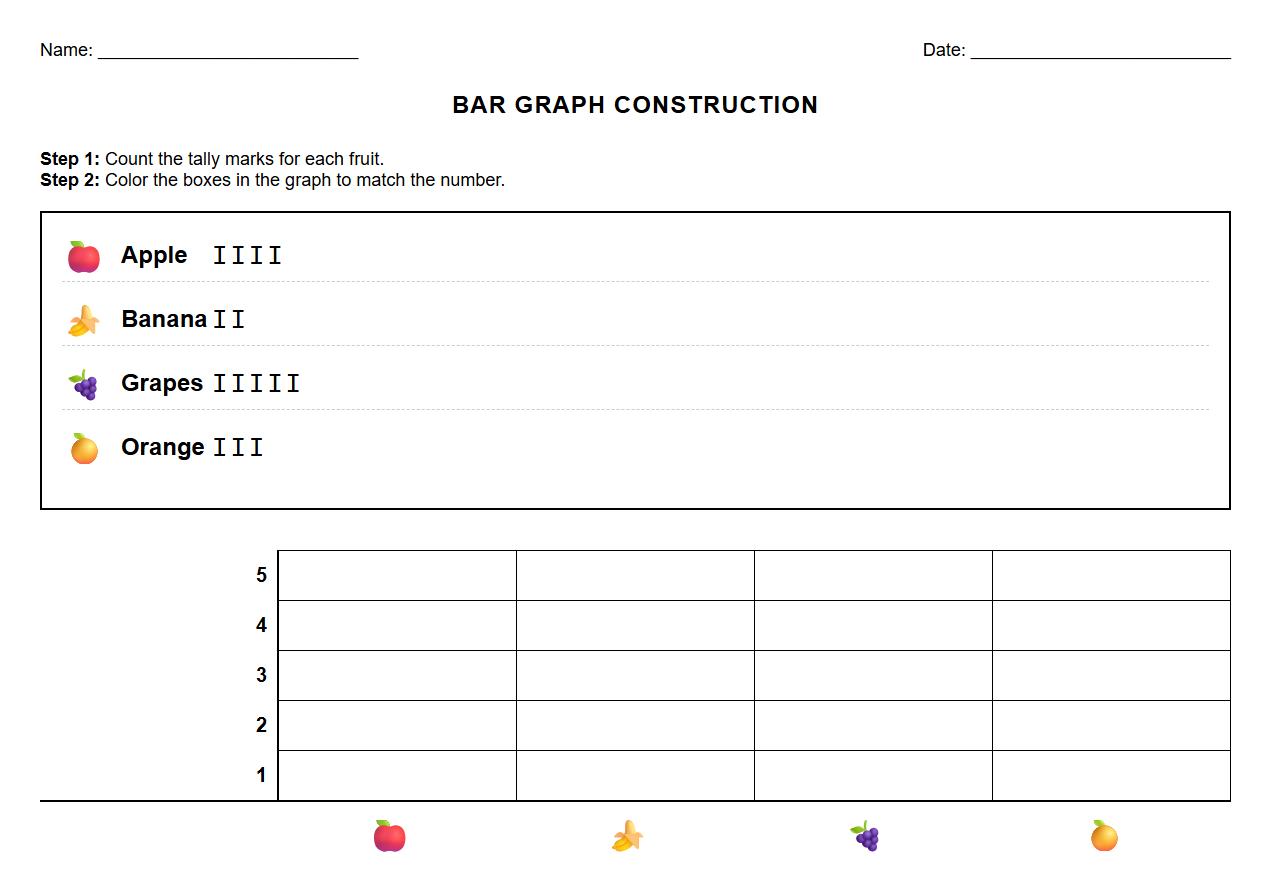
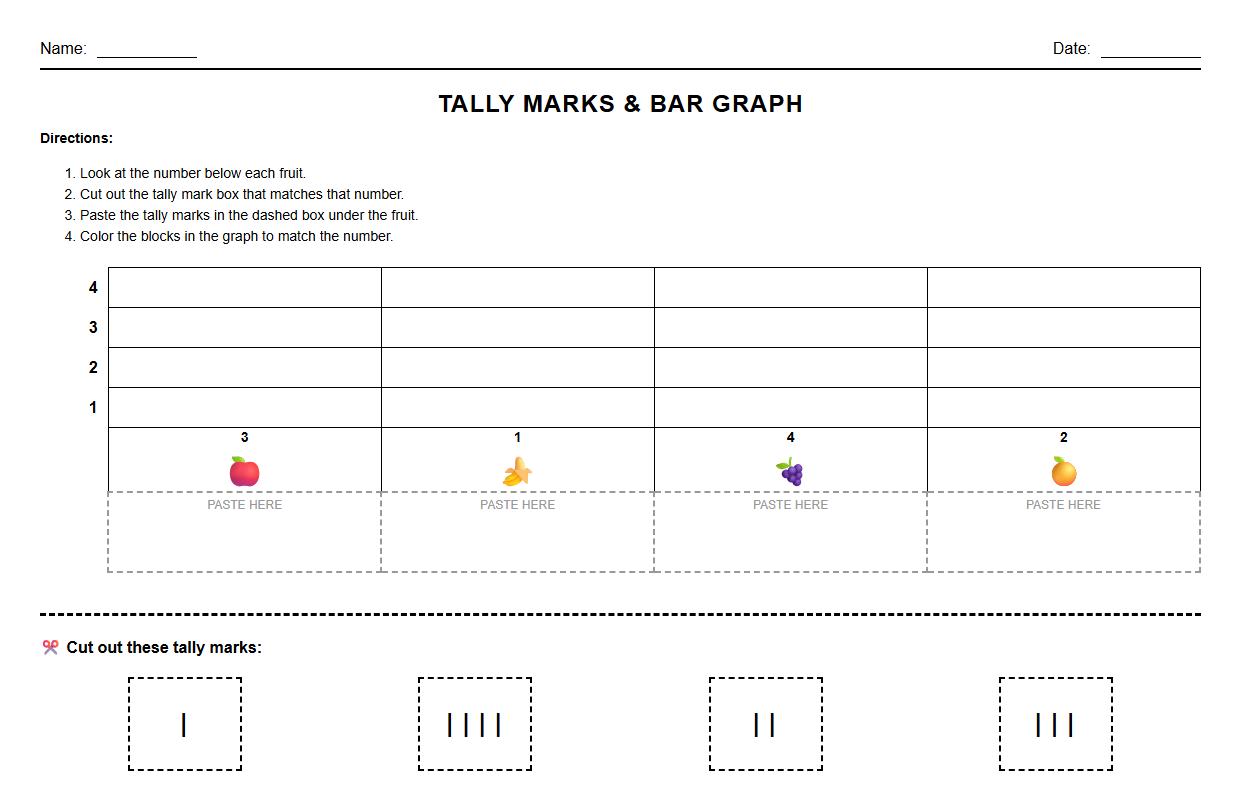
Bar Graph Construction from Tally Data Worksheet

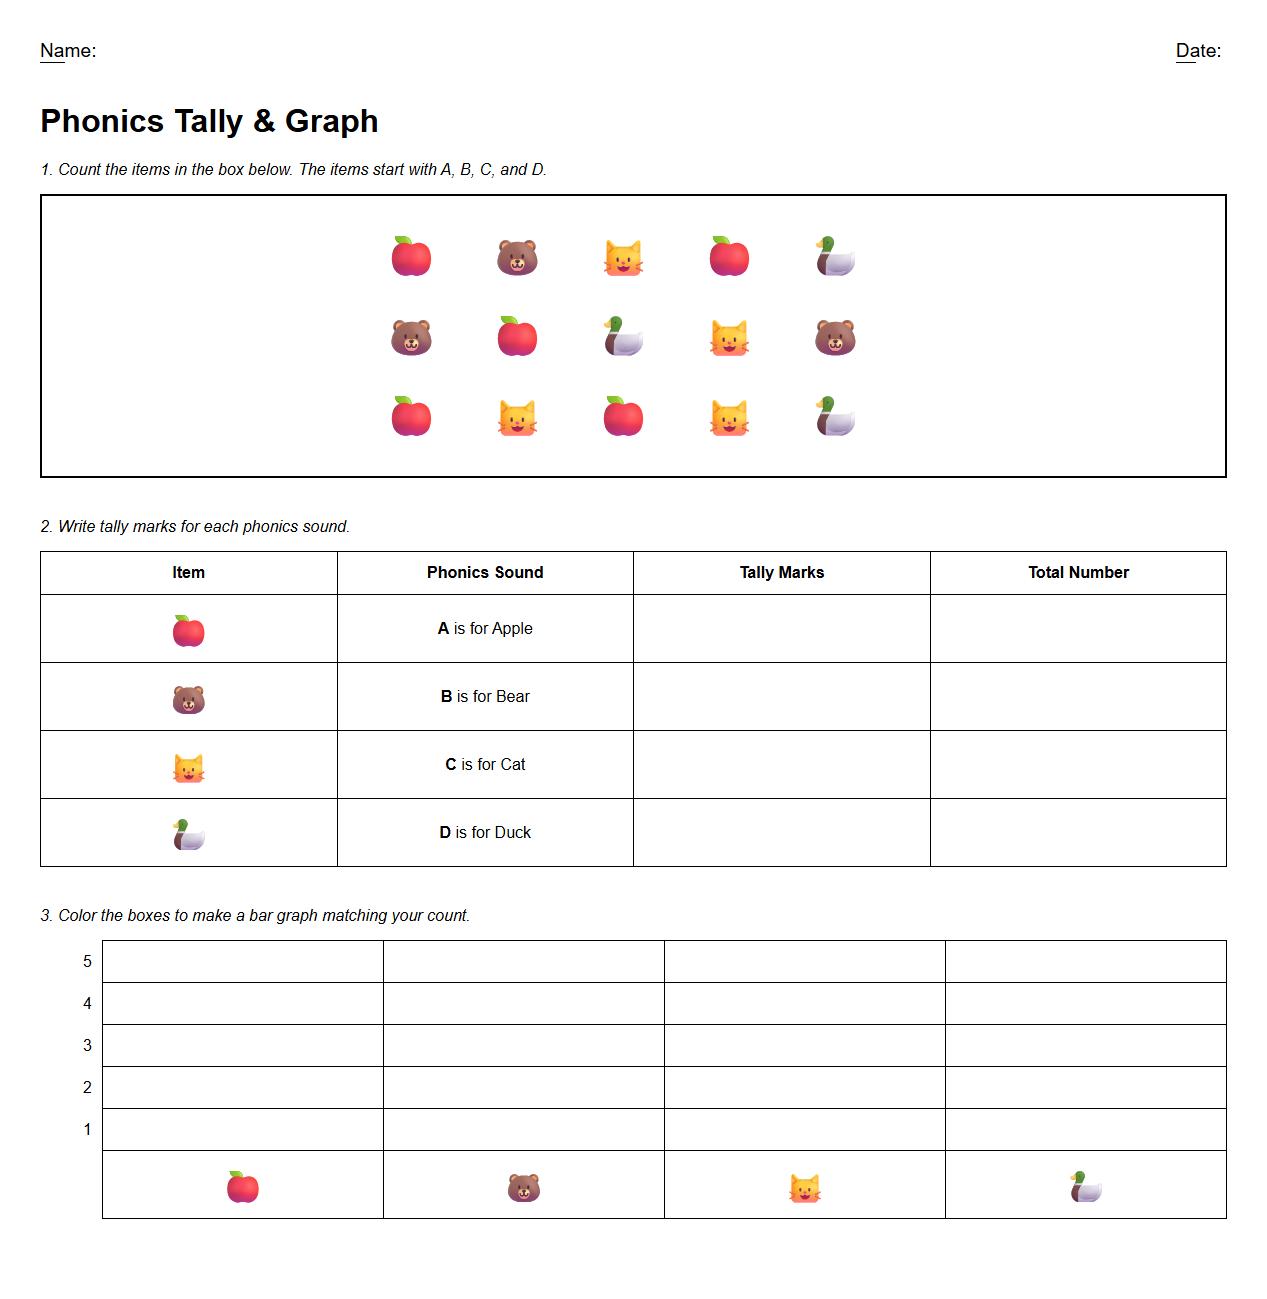
Phonics Themed Tally Marks to Bar Graph Activity

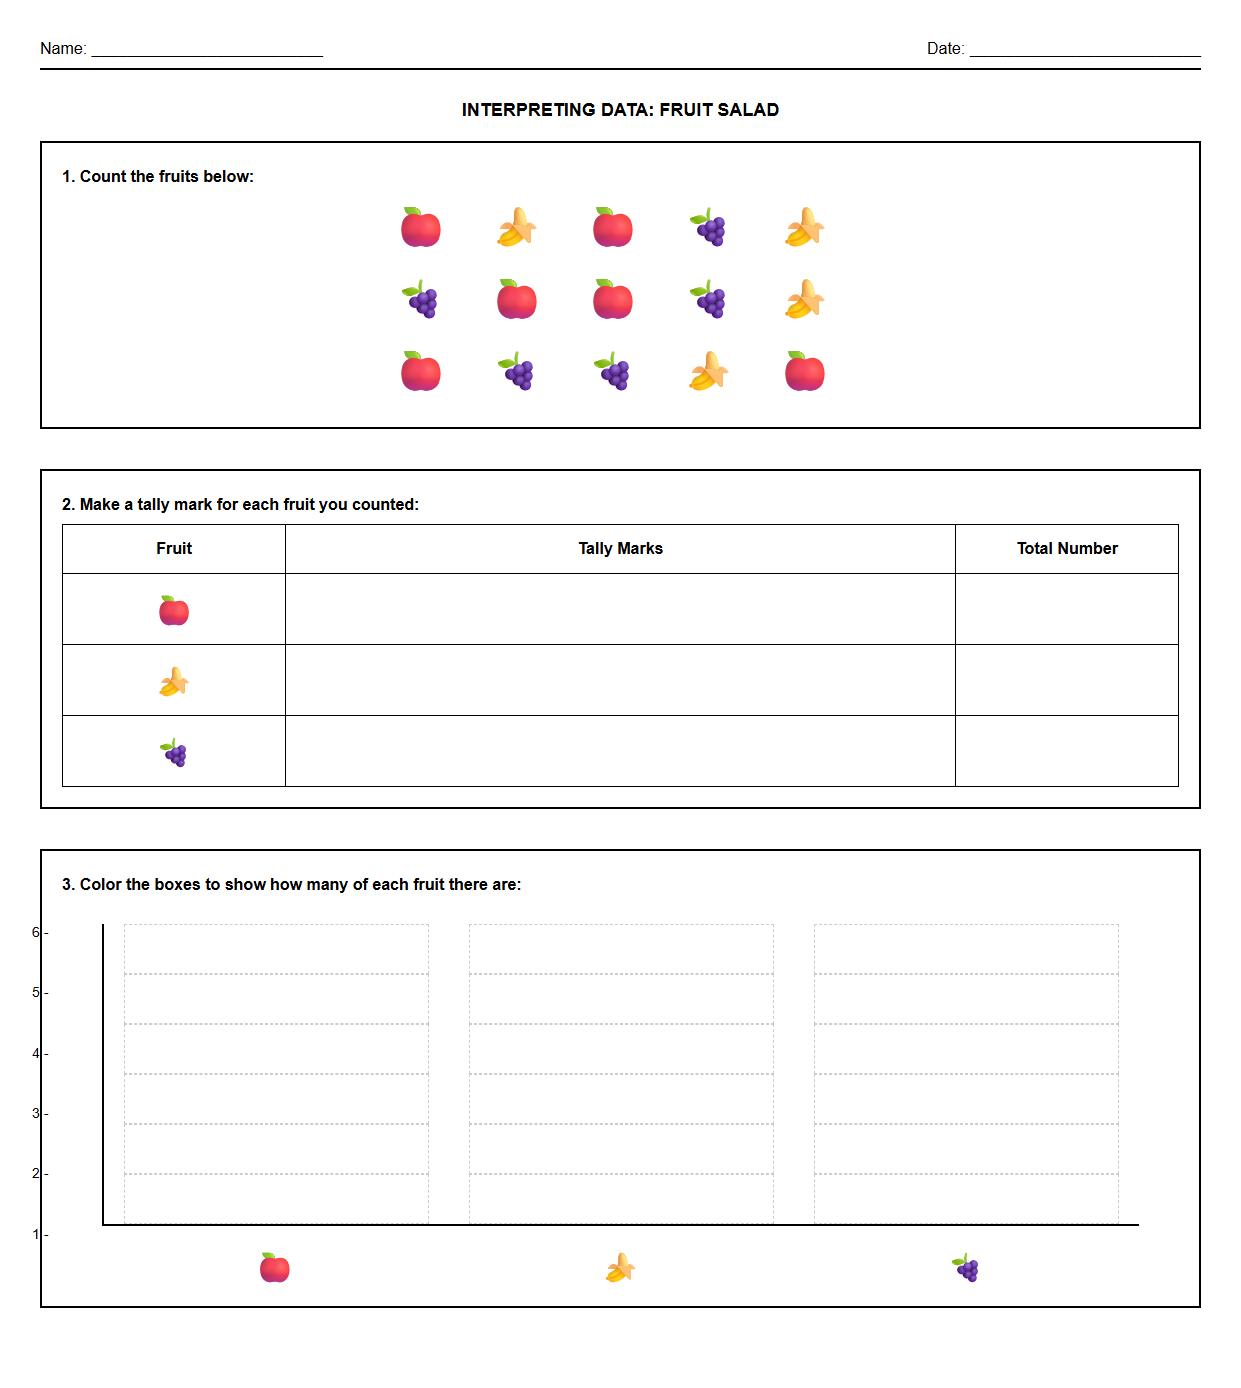
Interpreting Data Using Tally Marks and Bar Graphs Worksheet

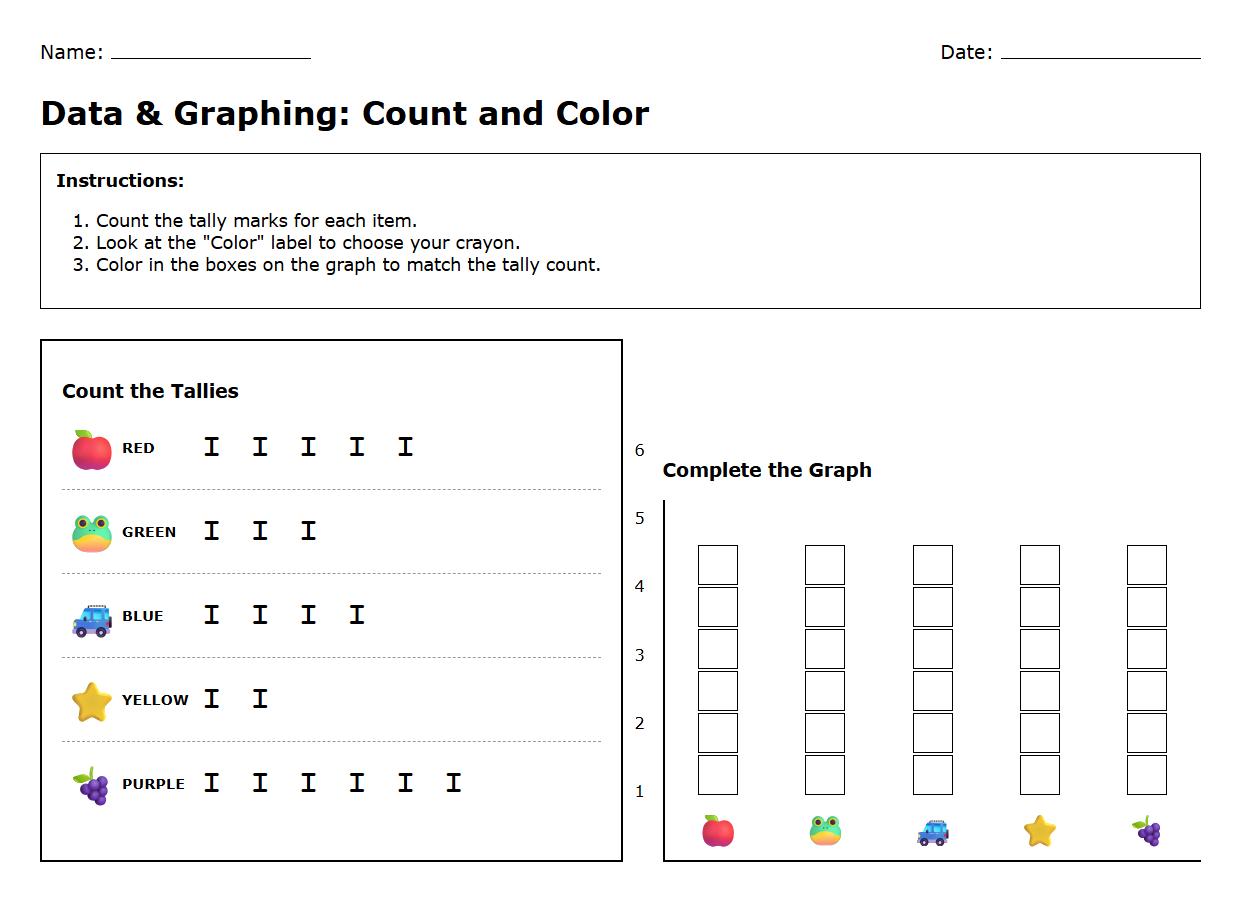
Color Coded Tally Marks to Bar Graph Comparison

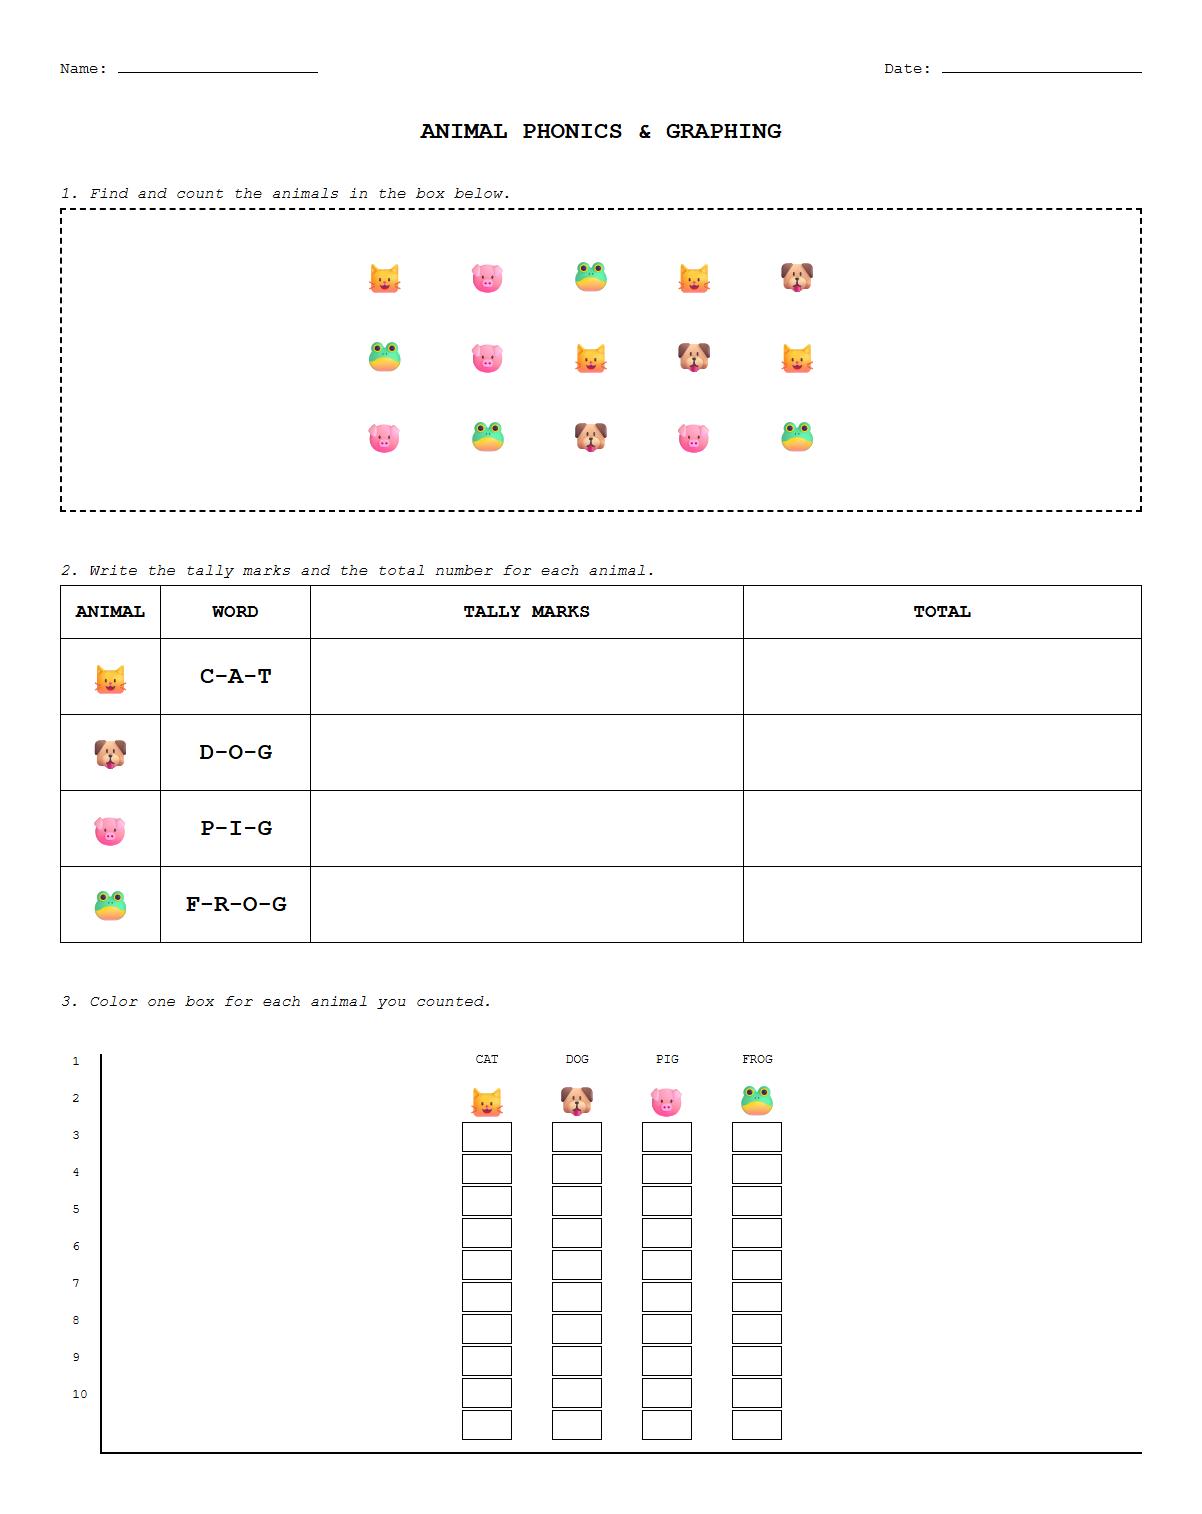
Animal Names Phonics Tally Marks to Bar Graph Worksheet

Reading and Analyzing Tally Marks in Bar Graphs Exercise

Cut and Paste Tally Marks to Bar Graph Worksheet

Fill in the Blanks with Tally Marks and Bar Graphs Worksheet

 Kindergarten Friendly Graphing and Tally Data Worksheet