
Developing early math skills is essential, and creating tally charts helps young learners understand data collection and organization. This hands-on activity encourages counting, grouping, and visual representation of information, fostering analytical thinking from a young age. Explore our collection of Create Your Own Tally Chart Worksheets to engage early learners in interactive data practice.
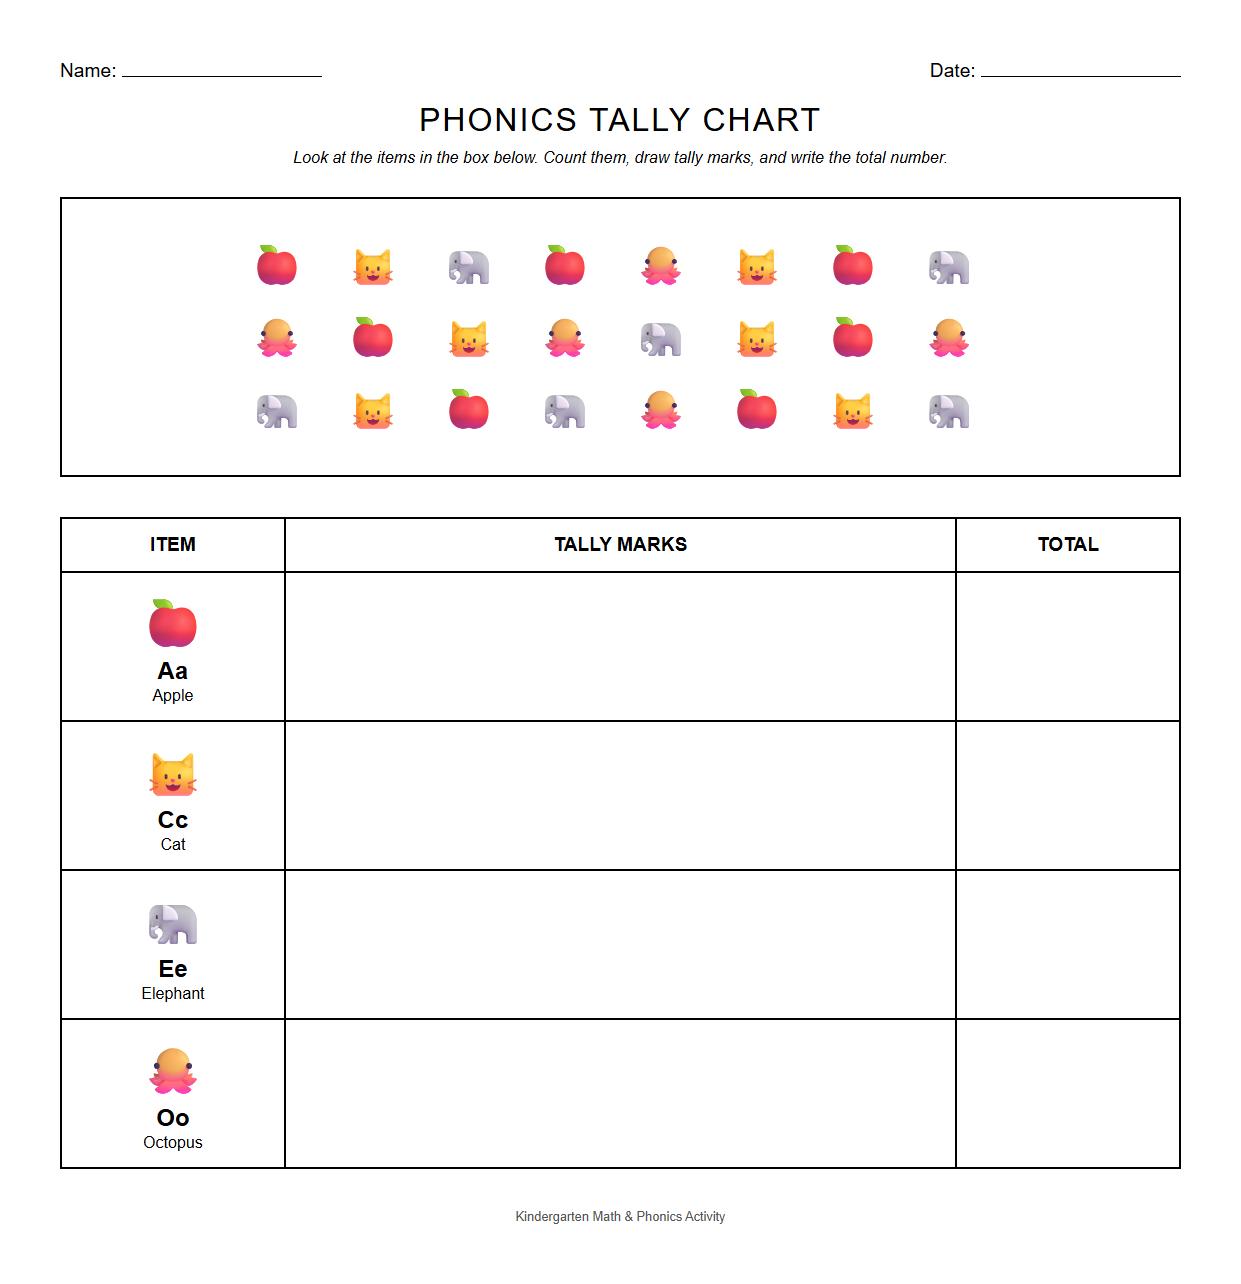
Create Your Own Tally Chart Phonics Worksheet


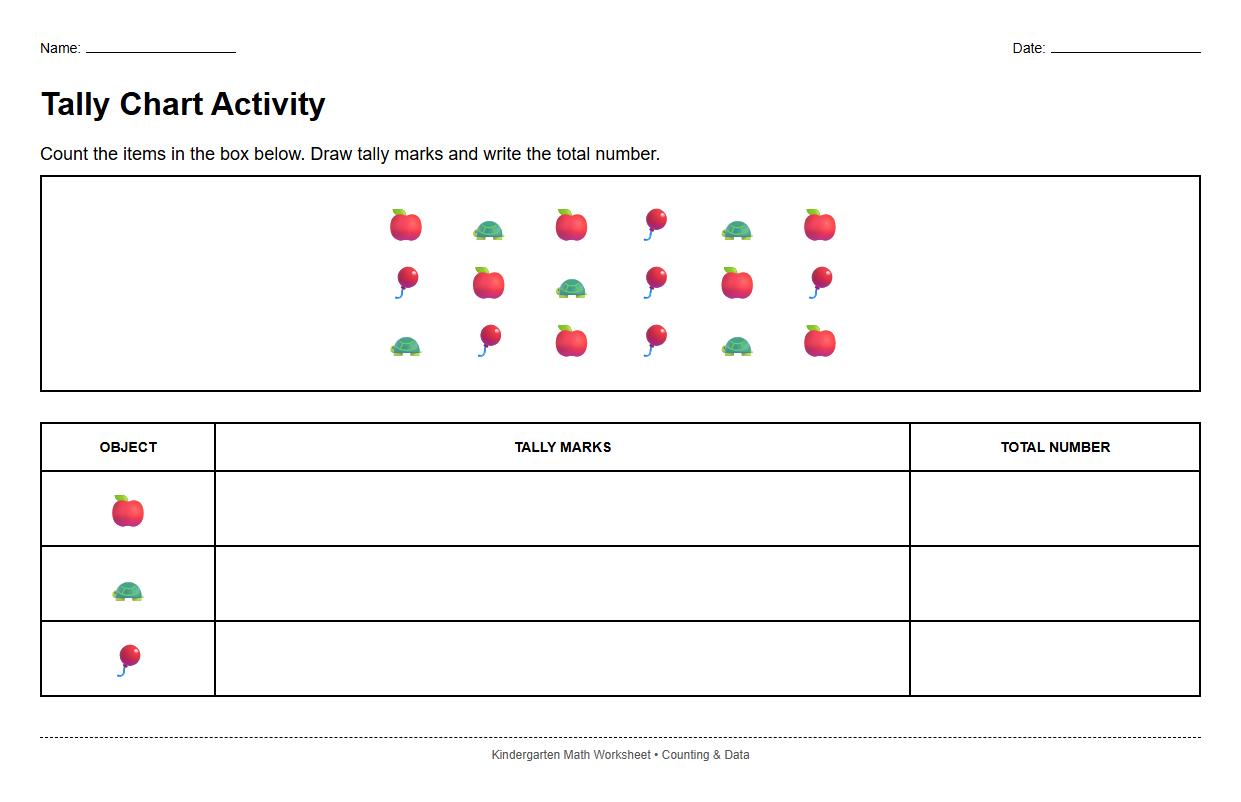
Tally Chart Worksheet for Counting Objects Activity

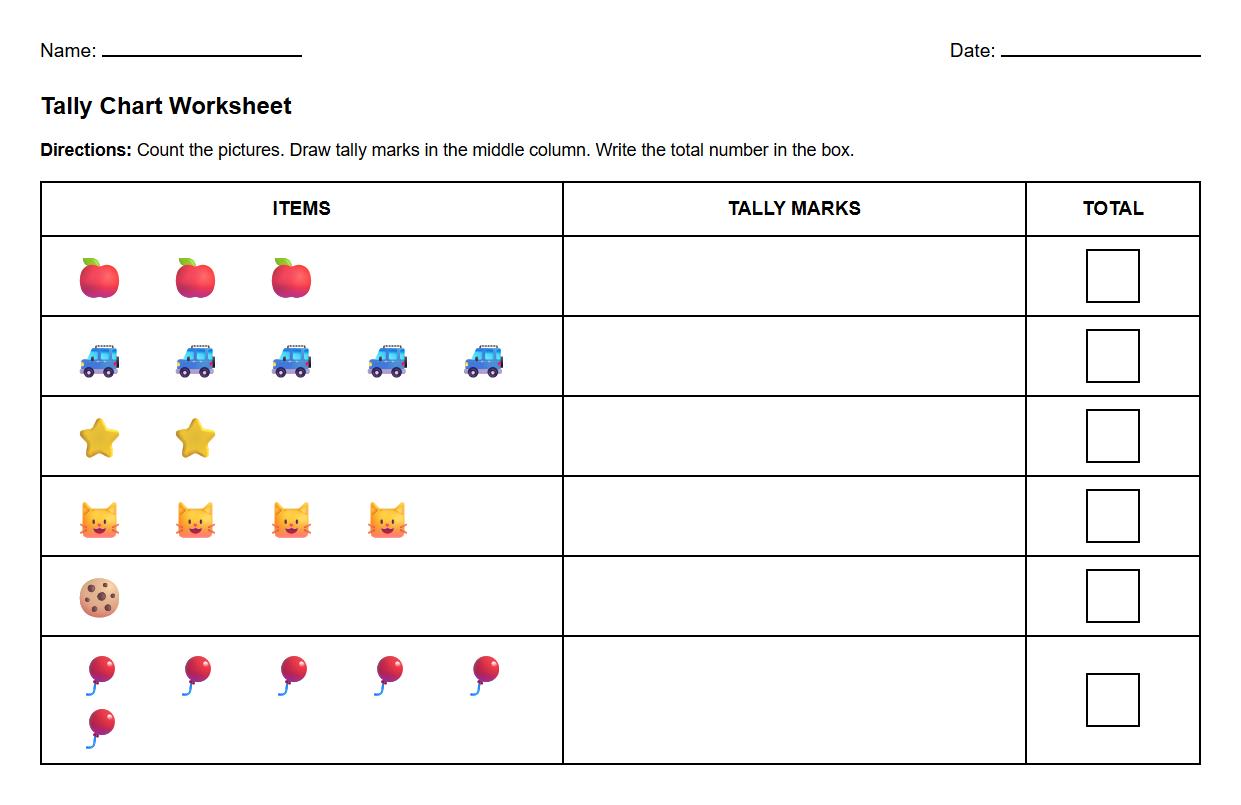
Tally Chart Numbers and Quantities Math Exercise

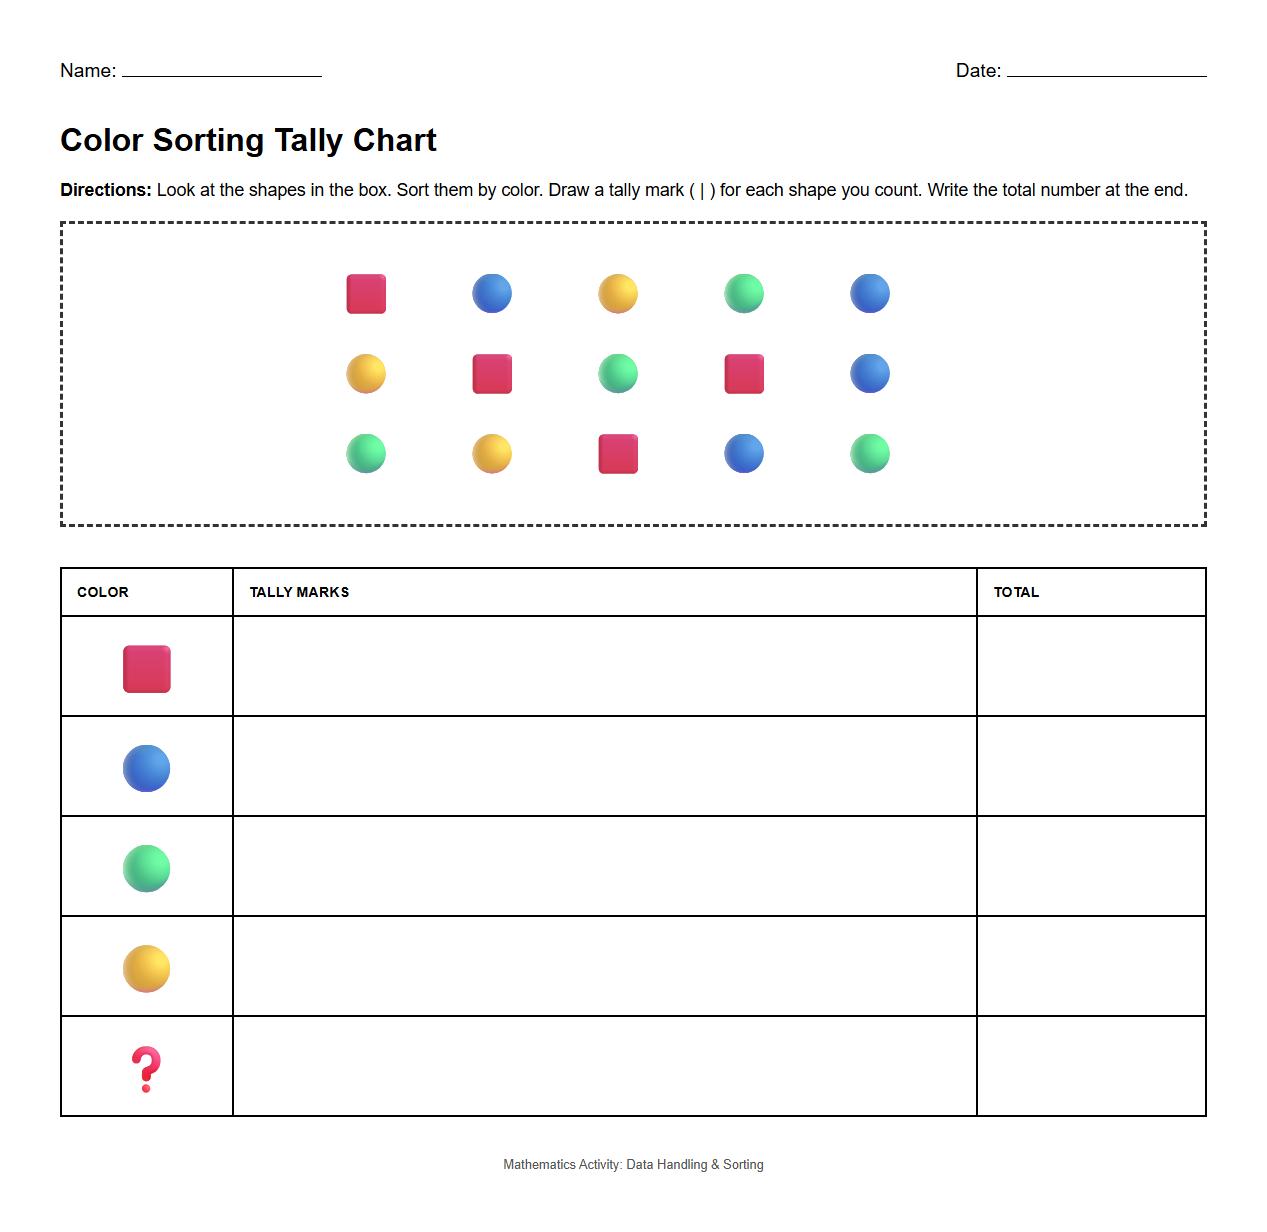
Customizable Tally Chart for Color Sorting Task

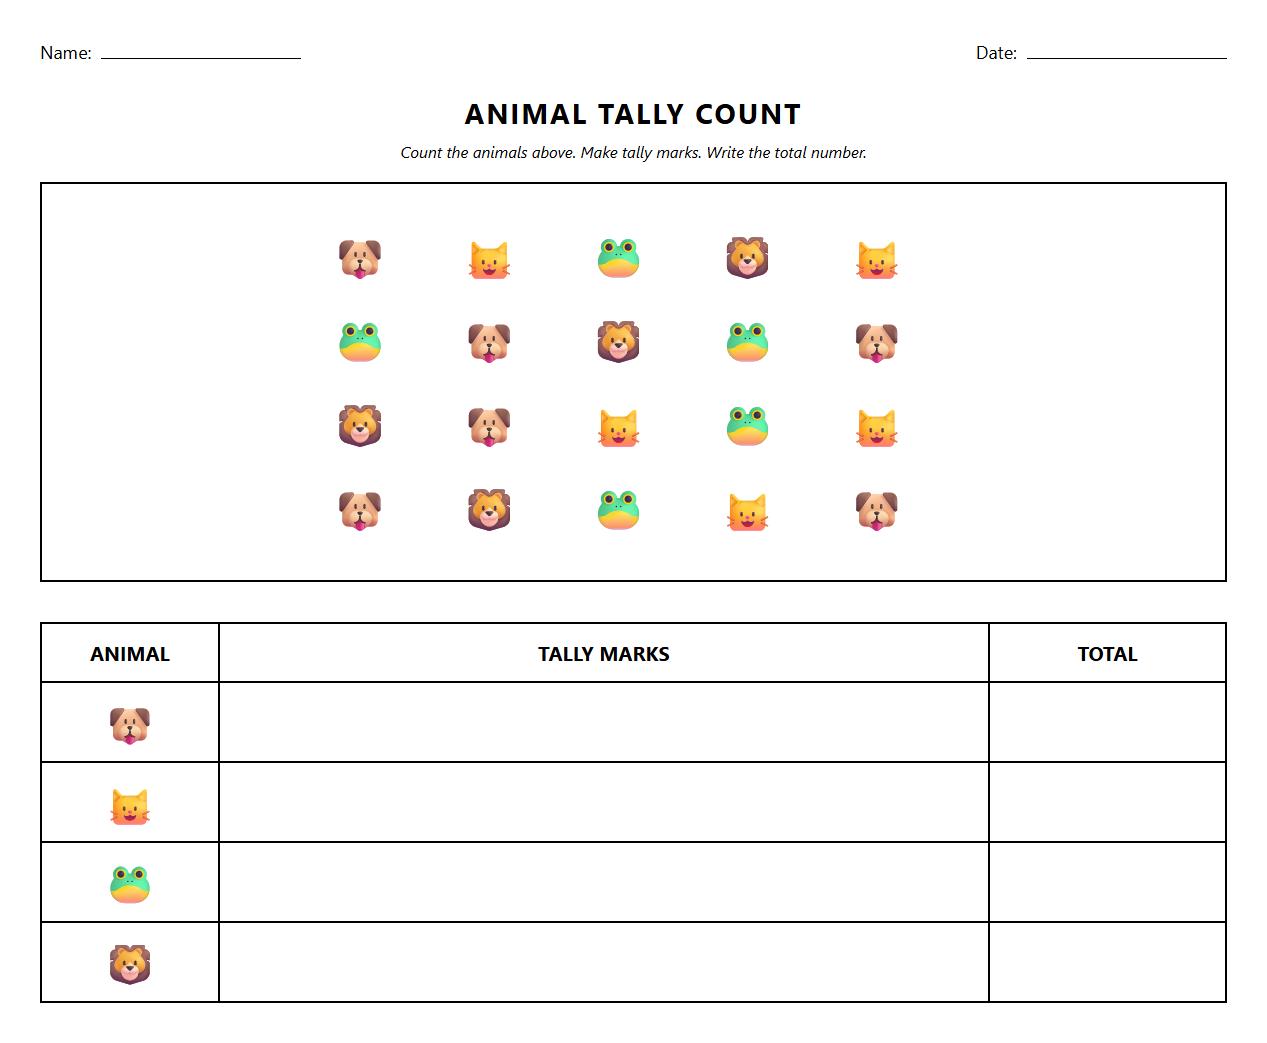
Animal Picture Sorting Tally Chart Worksheet

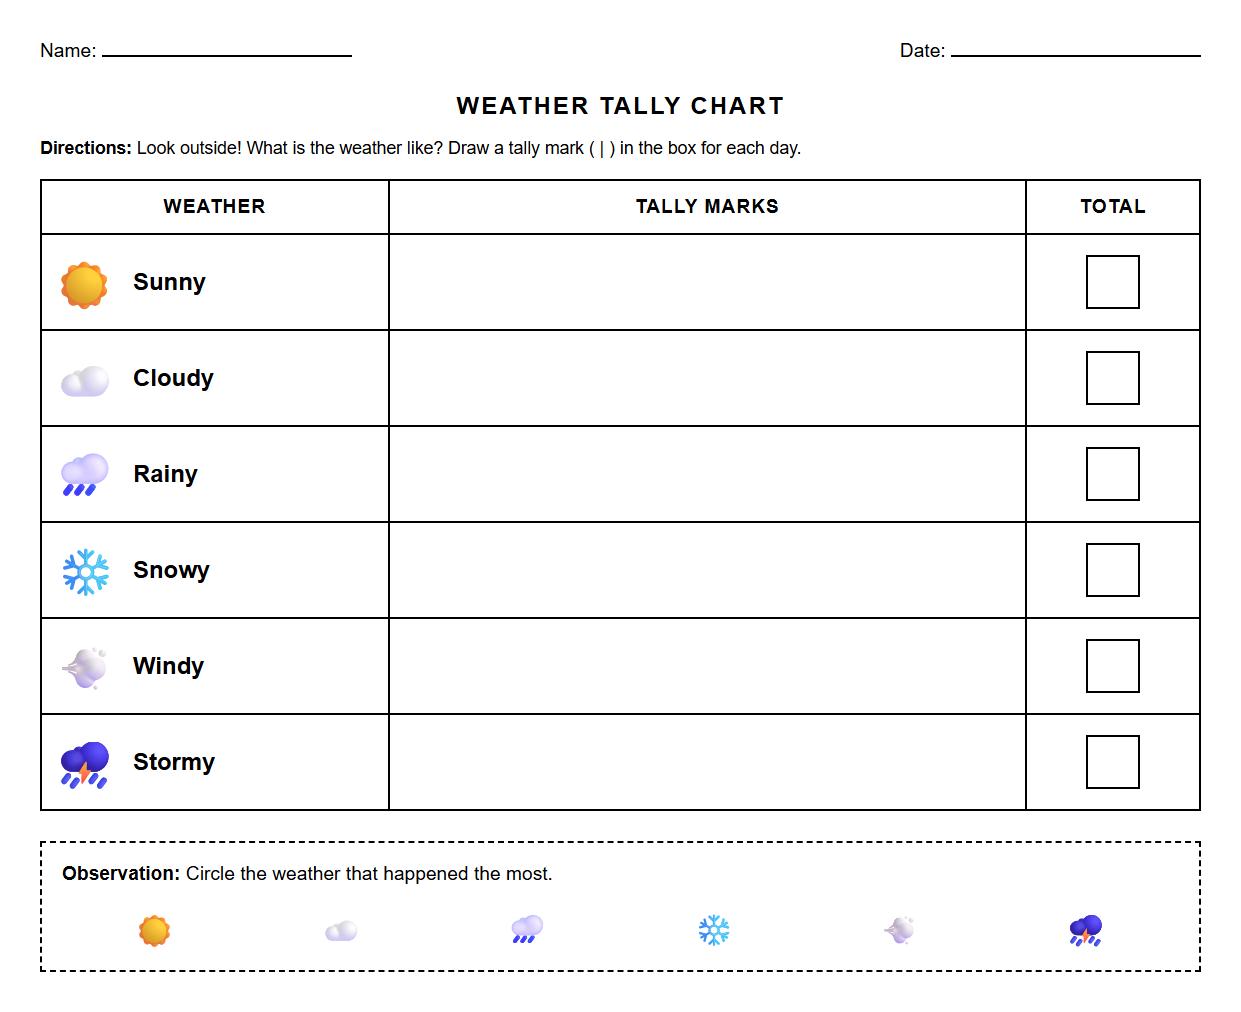
Early Learner Tally Chart for Weather Data Collection

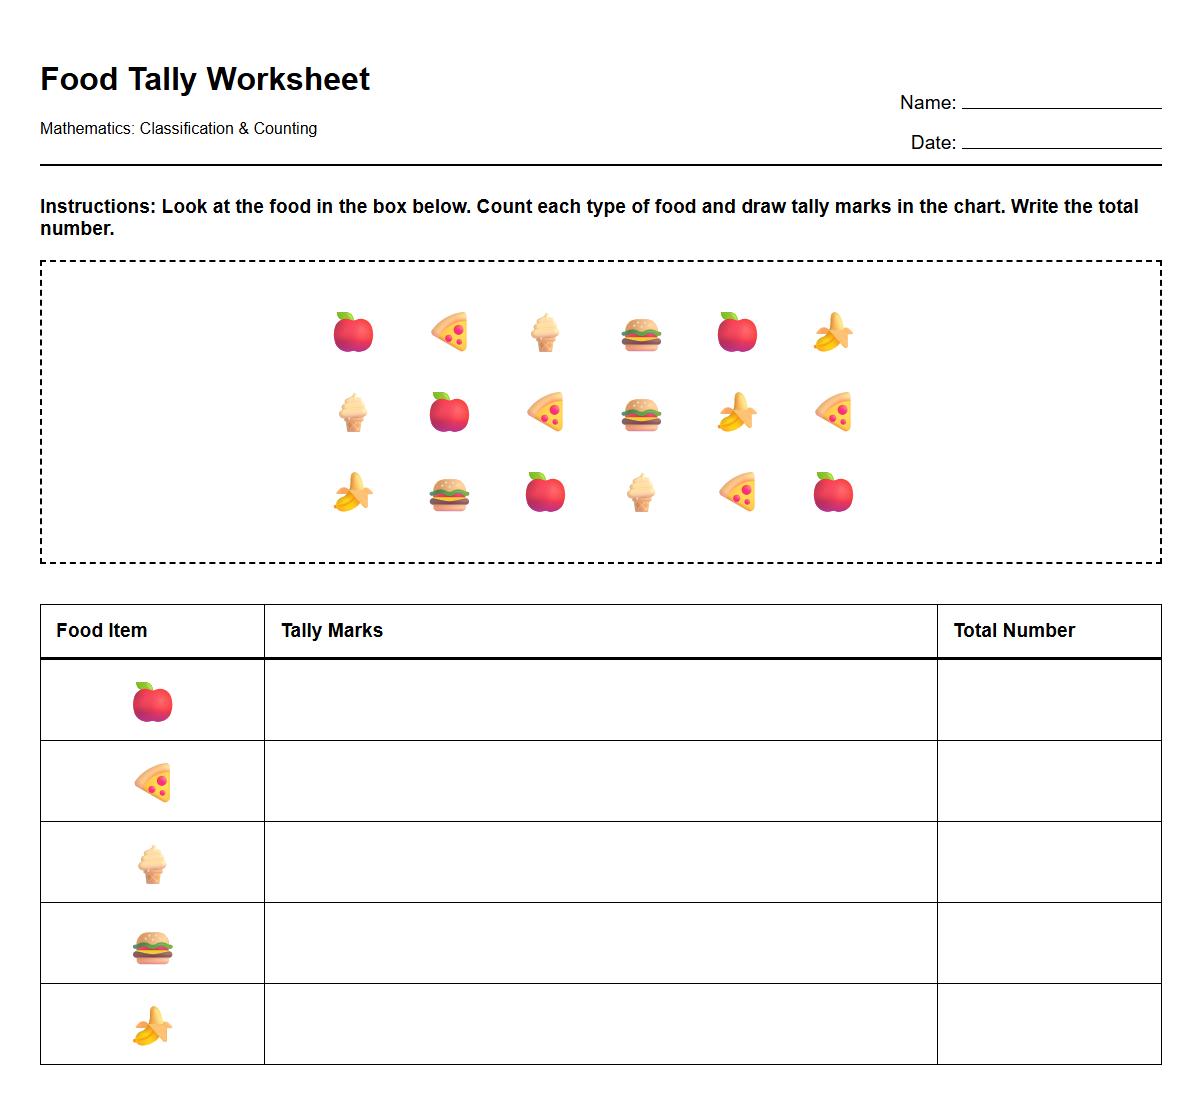
Food Item Tally Marks Worksheet for Classification Skills

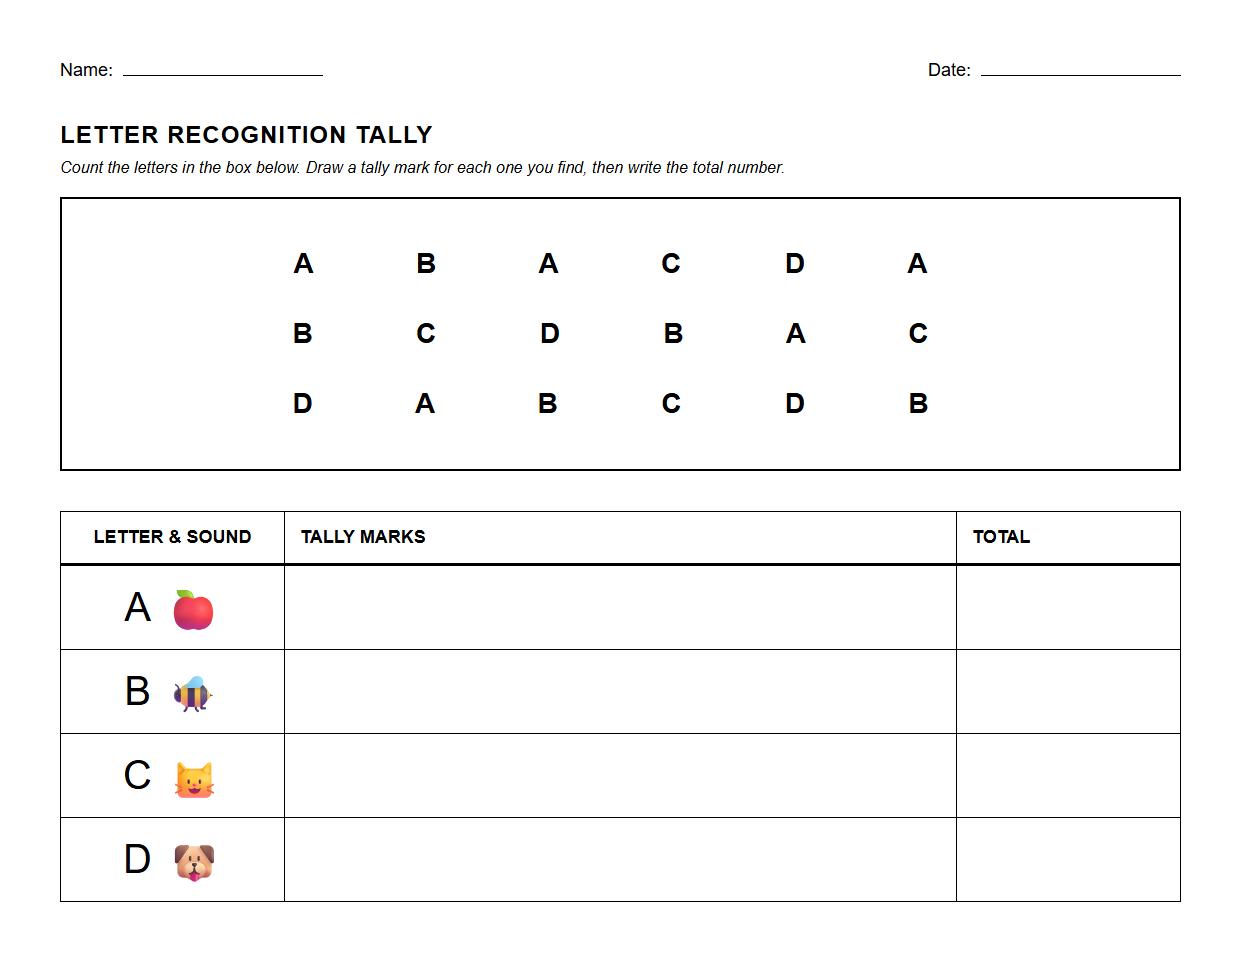
Tally Chart for Letter Recognition Phonics Practice

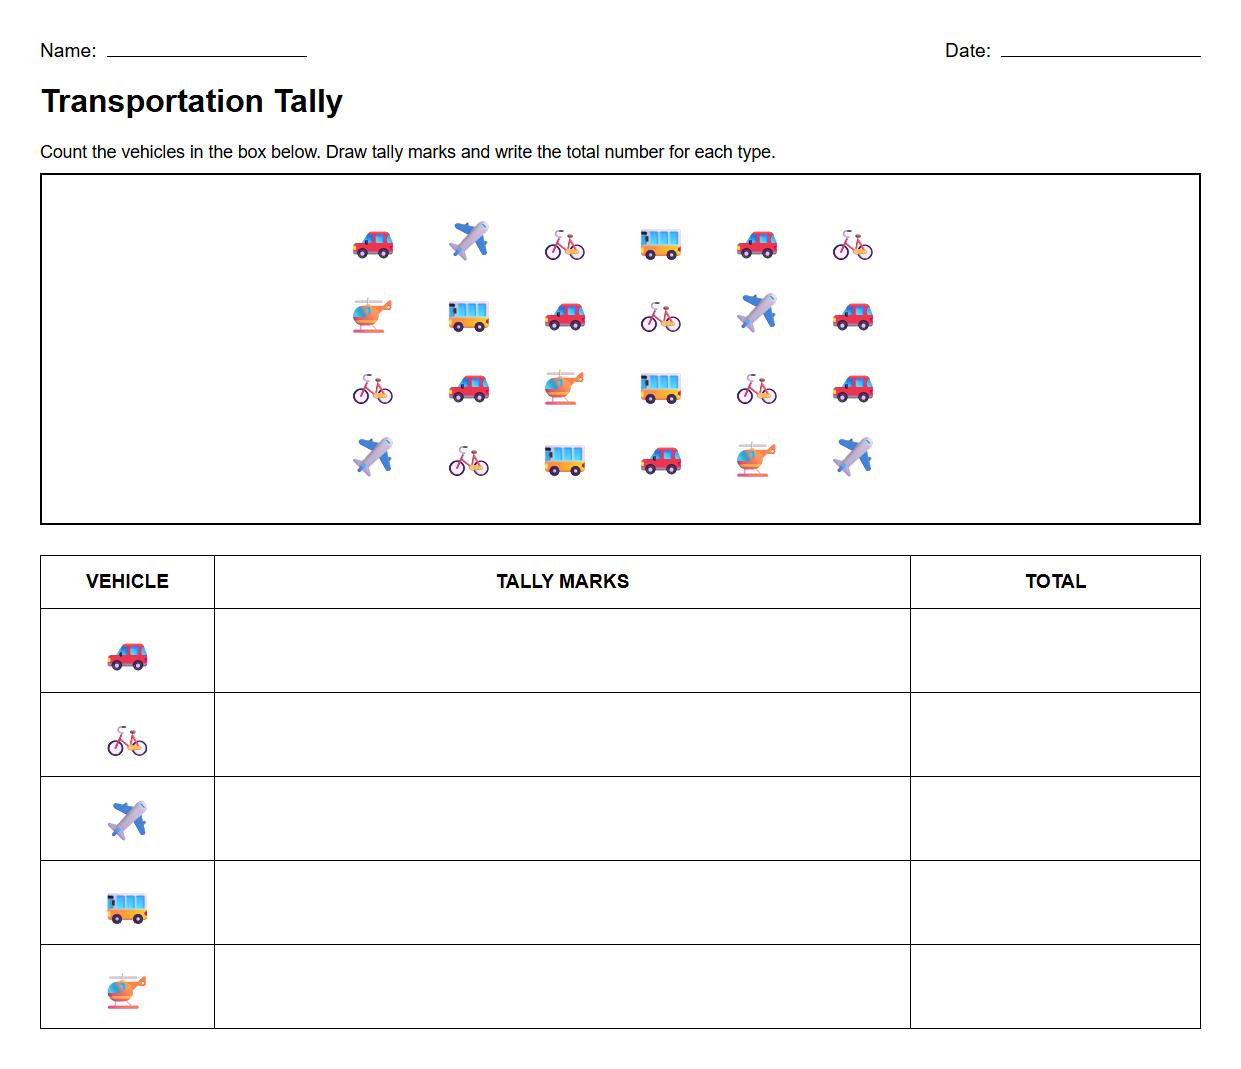
Transportation Modes Tally Chart Counting Worksheet

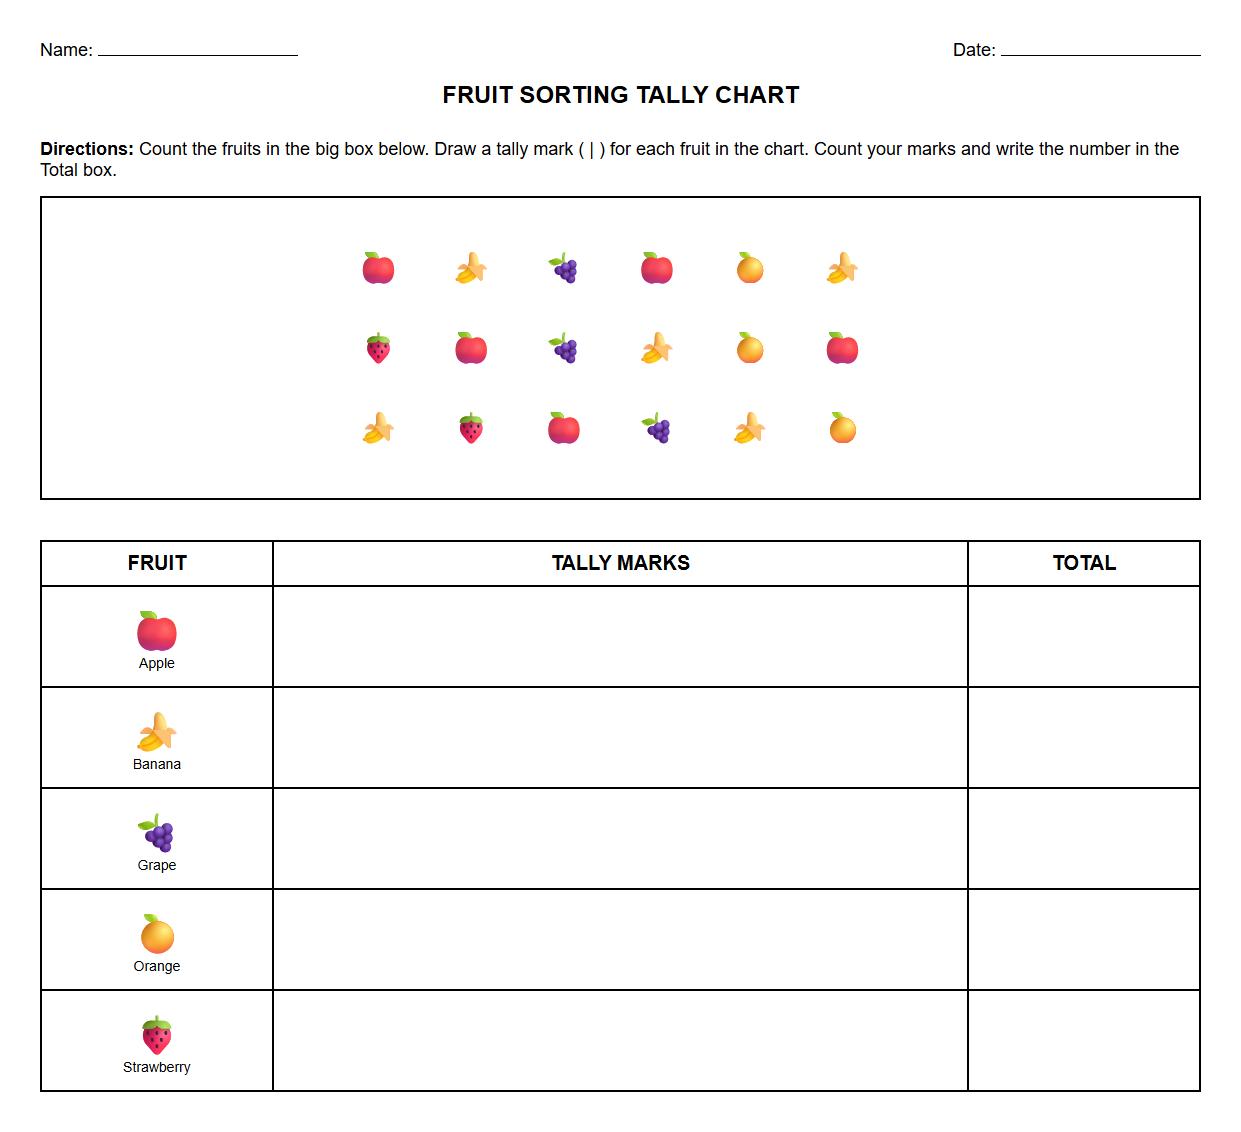
Fruit Sorting Tally Chart Worksheet for Data Representation

 Simple Data Representation with Graphing Worksheet