
Data graphing worksheets help young learners develop essential skills in organizing and interpreting information visually through charts and graphs. These activities support early math comprehension and encourage critical thinking by allowing children to compare data sets and recognize patterns. Explore our collection of engaging worksheets designed to make data graphing approachable and fun for kids.
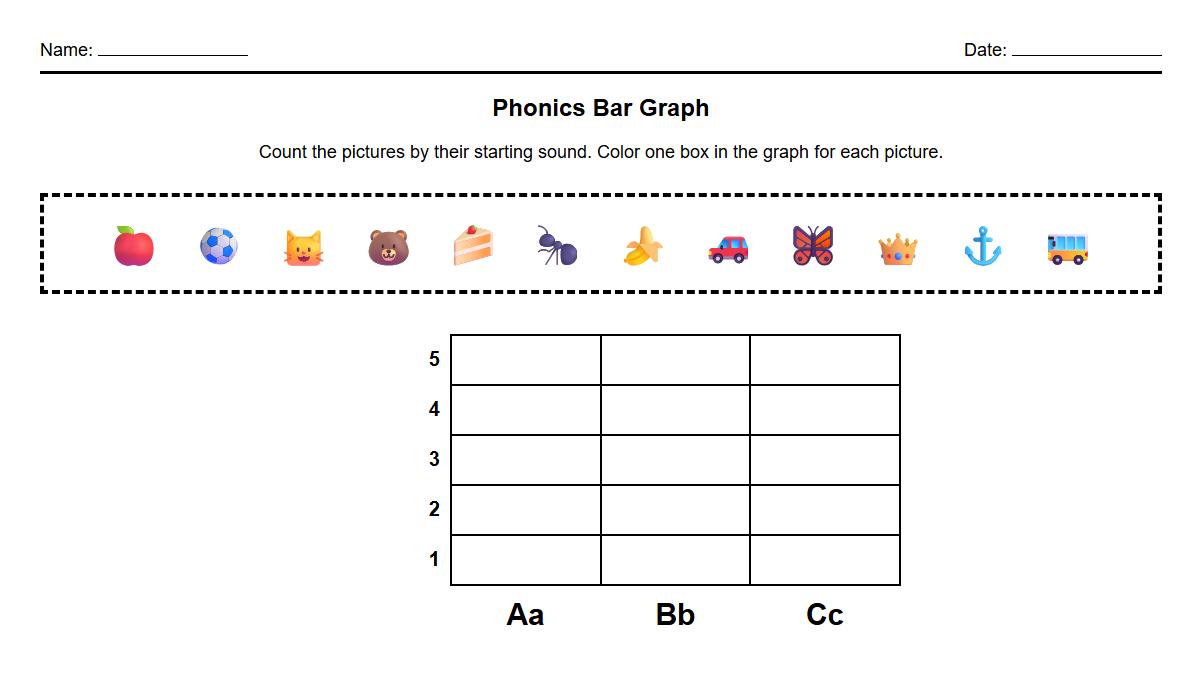
Bar Graph Phonics Picture Sorting Worksheet


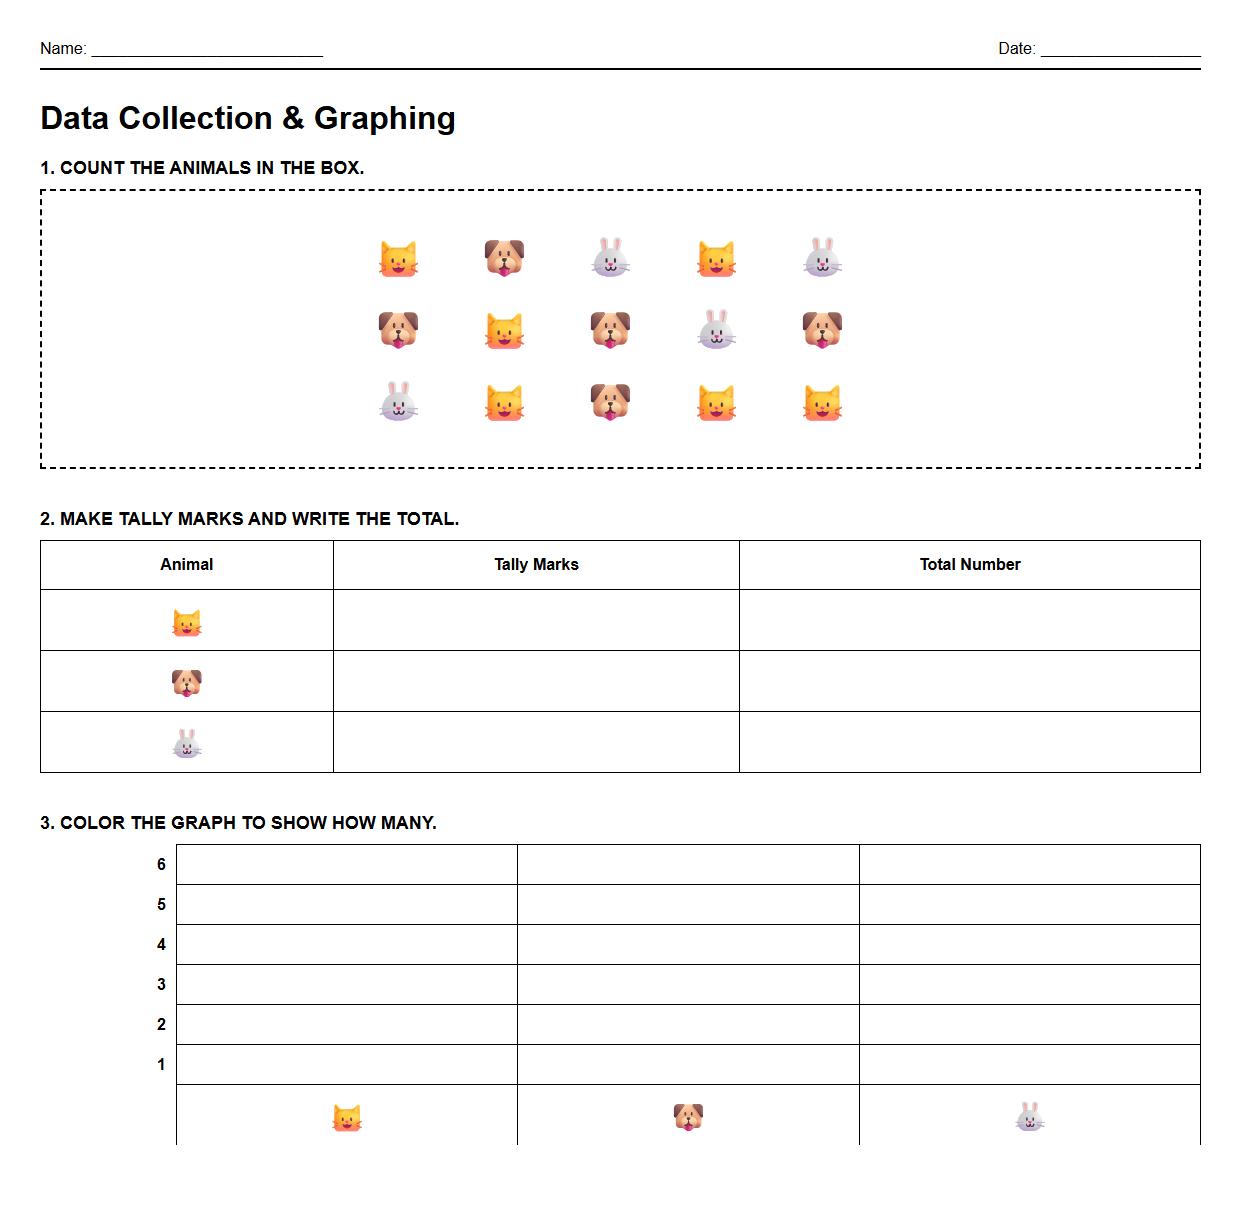
Tally Marks Data Collection and Graphing Worksheet

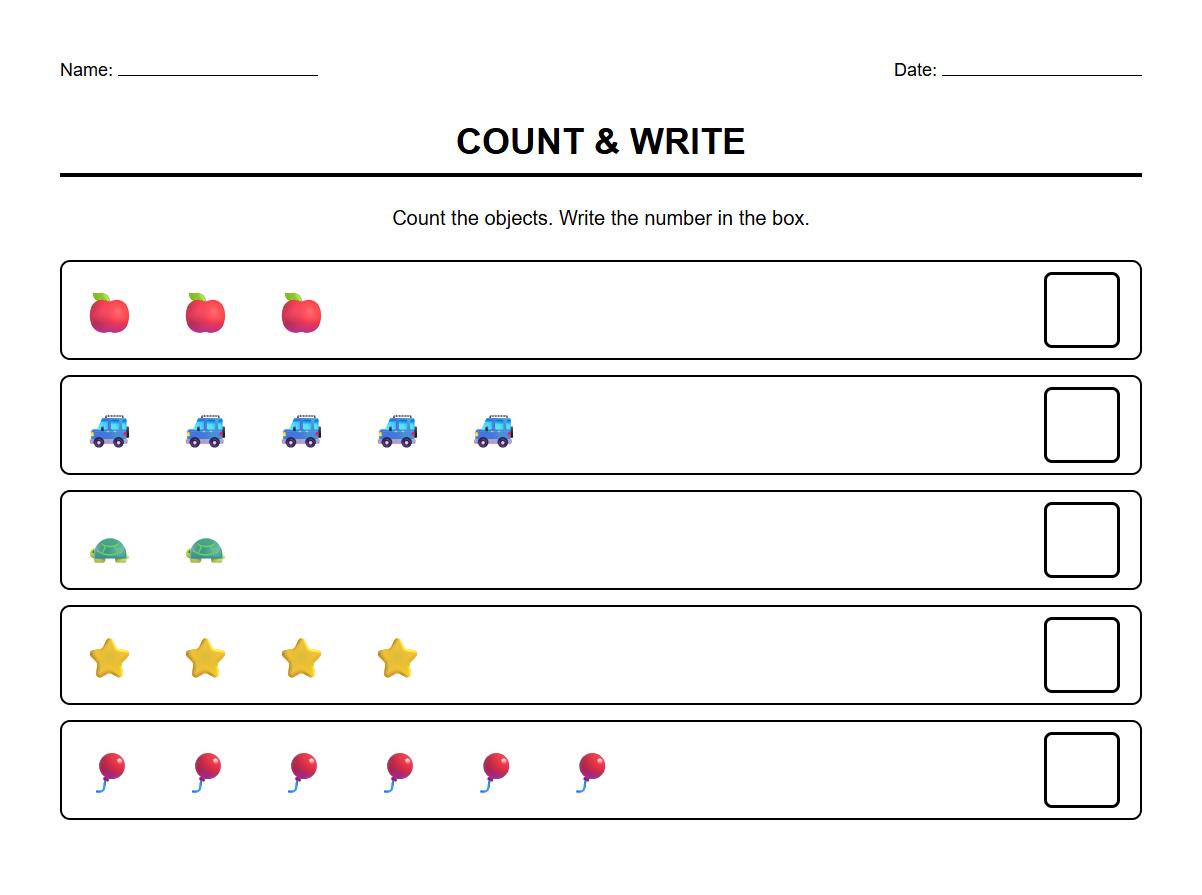
Pictograph Counting and Labeling Worksheet

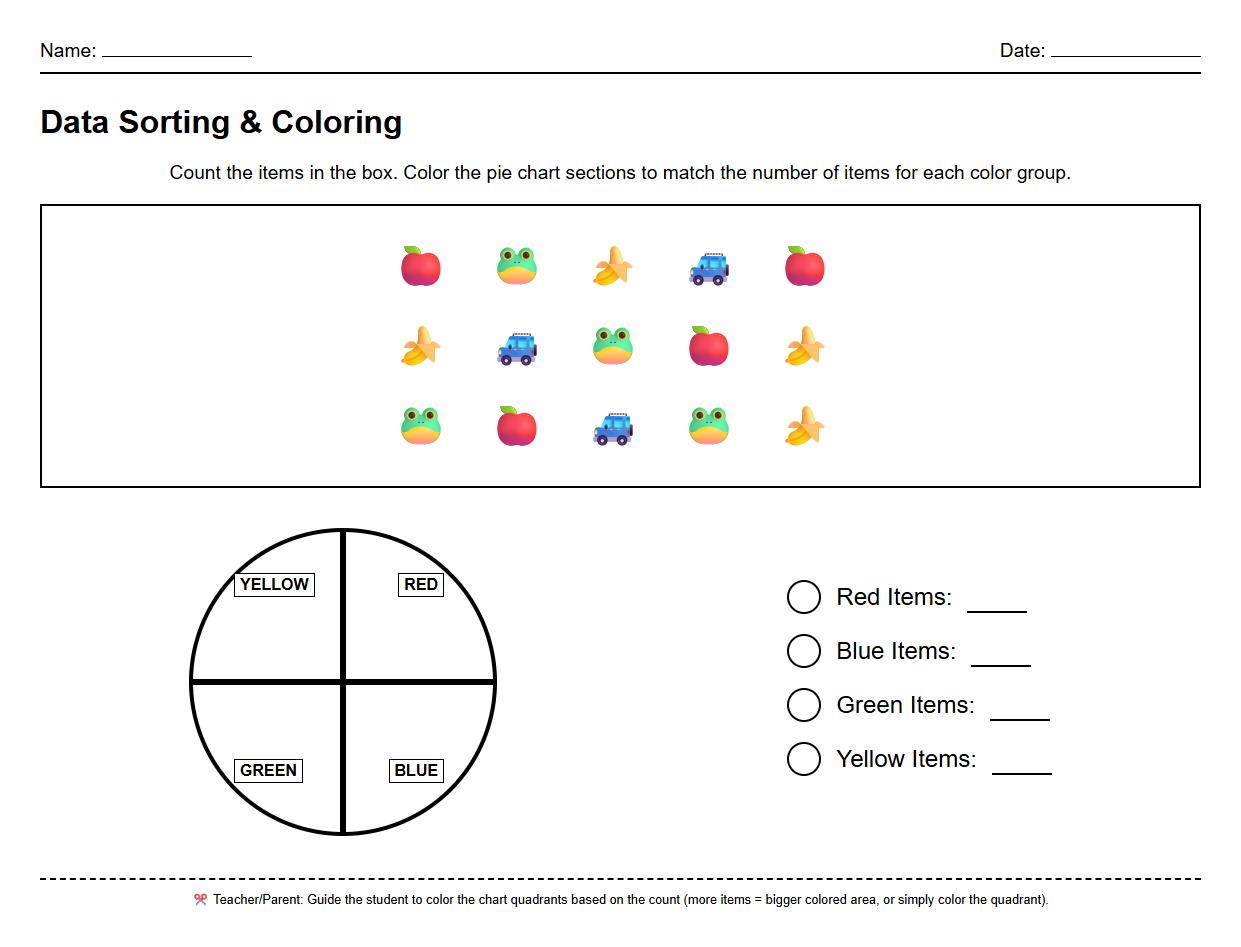
Pie Chart Color Object Sorting Worksheet

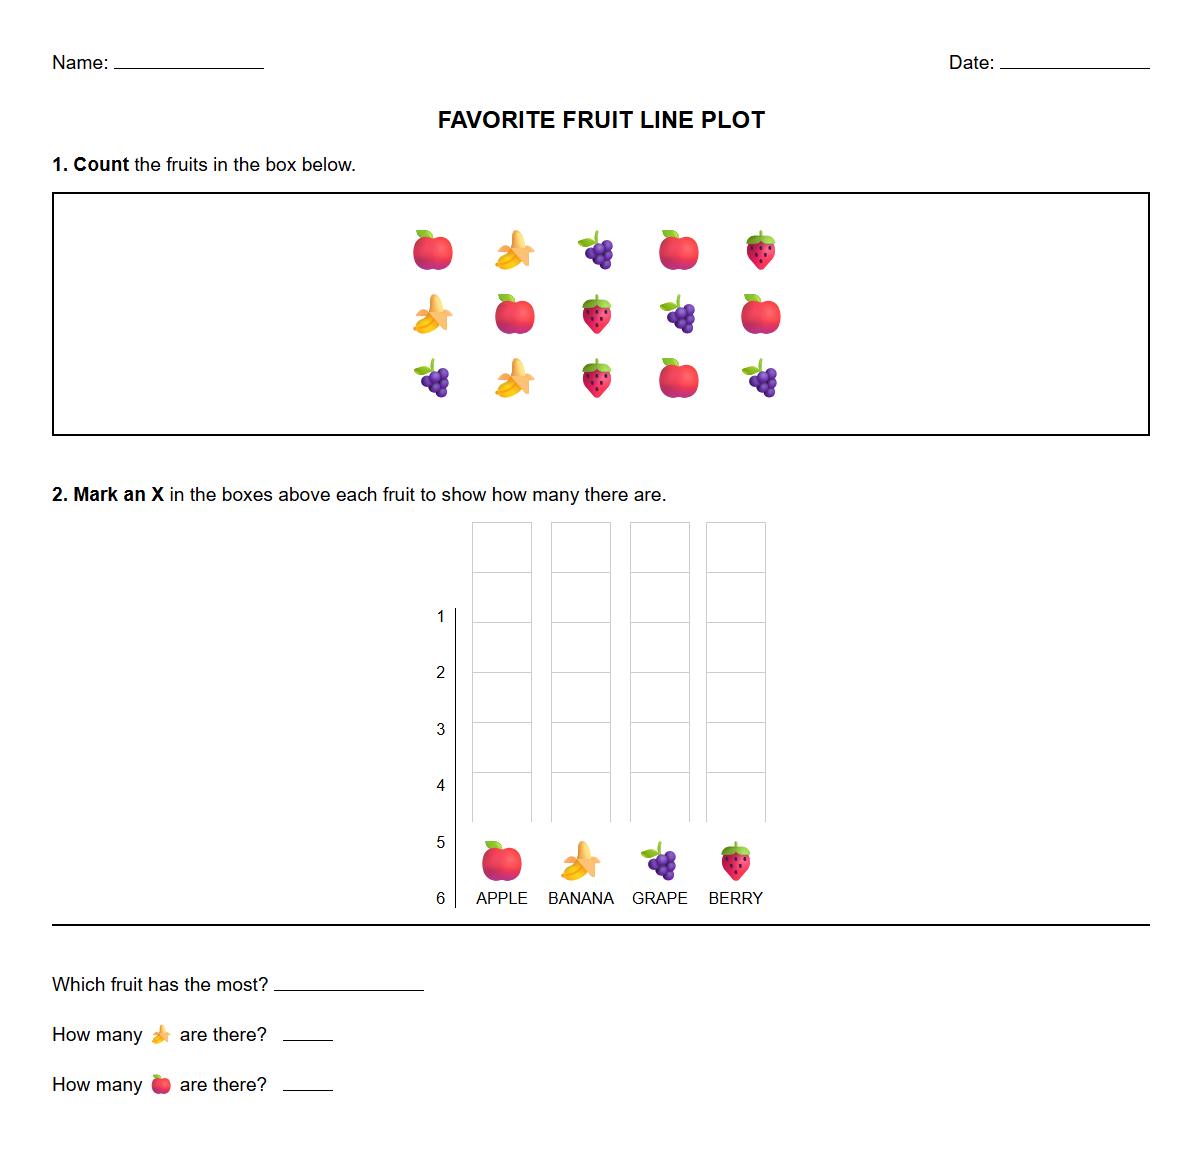
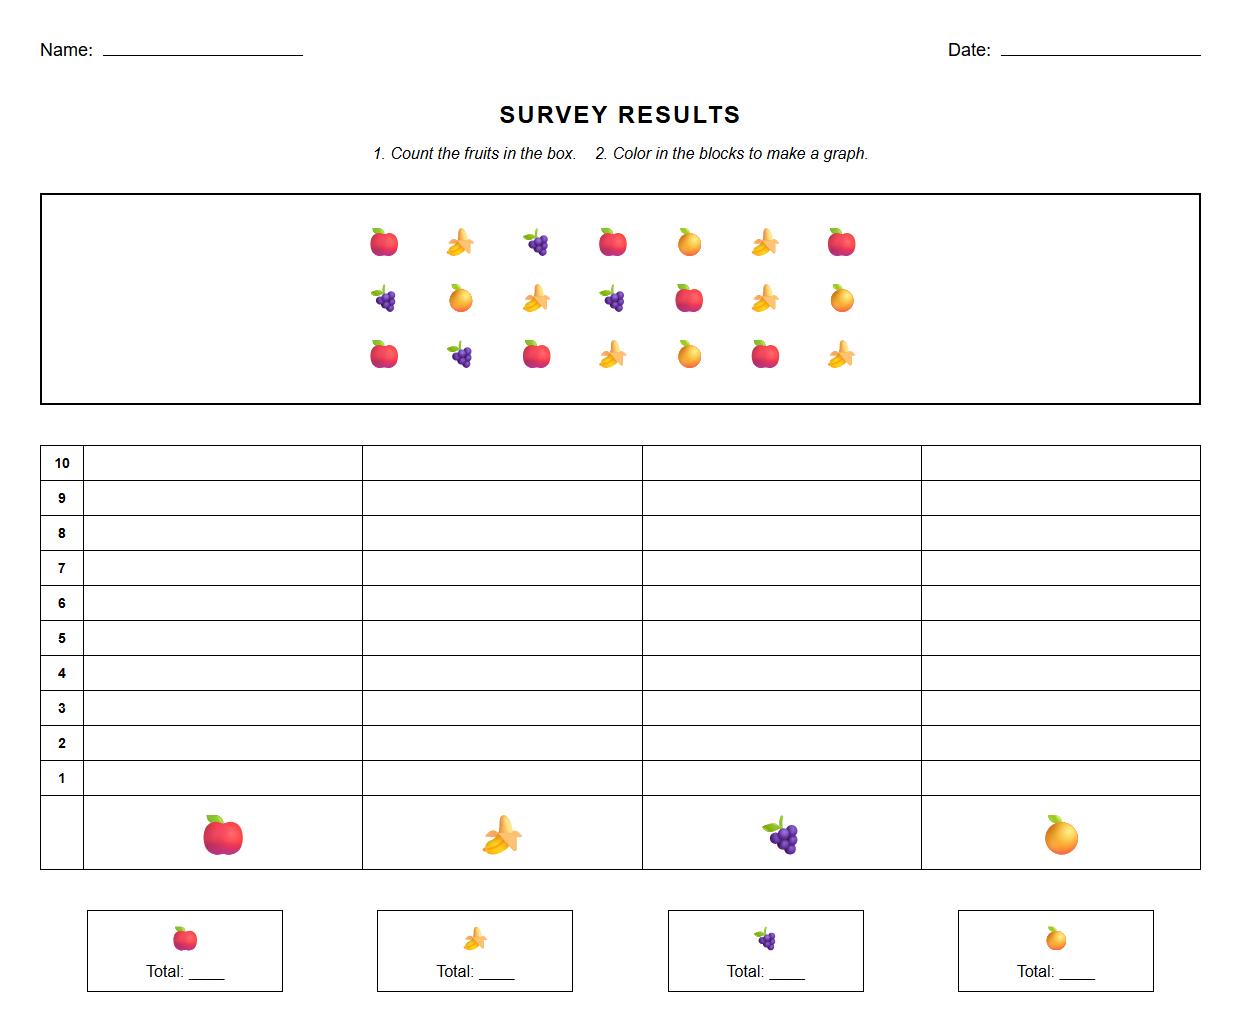
Simple Line Plot Favorite Fruit Worksheet

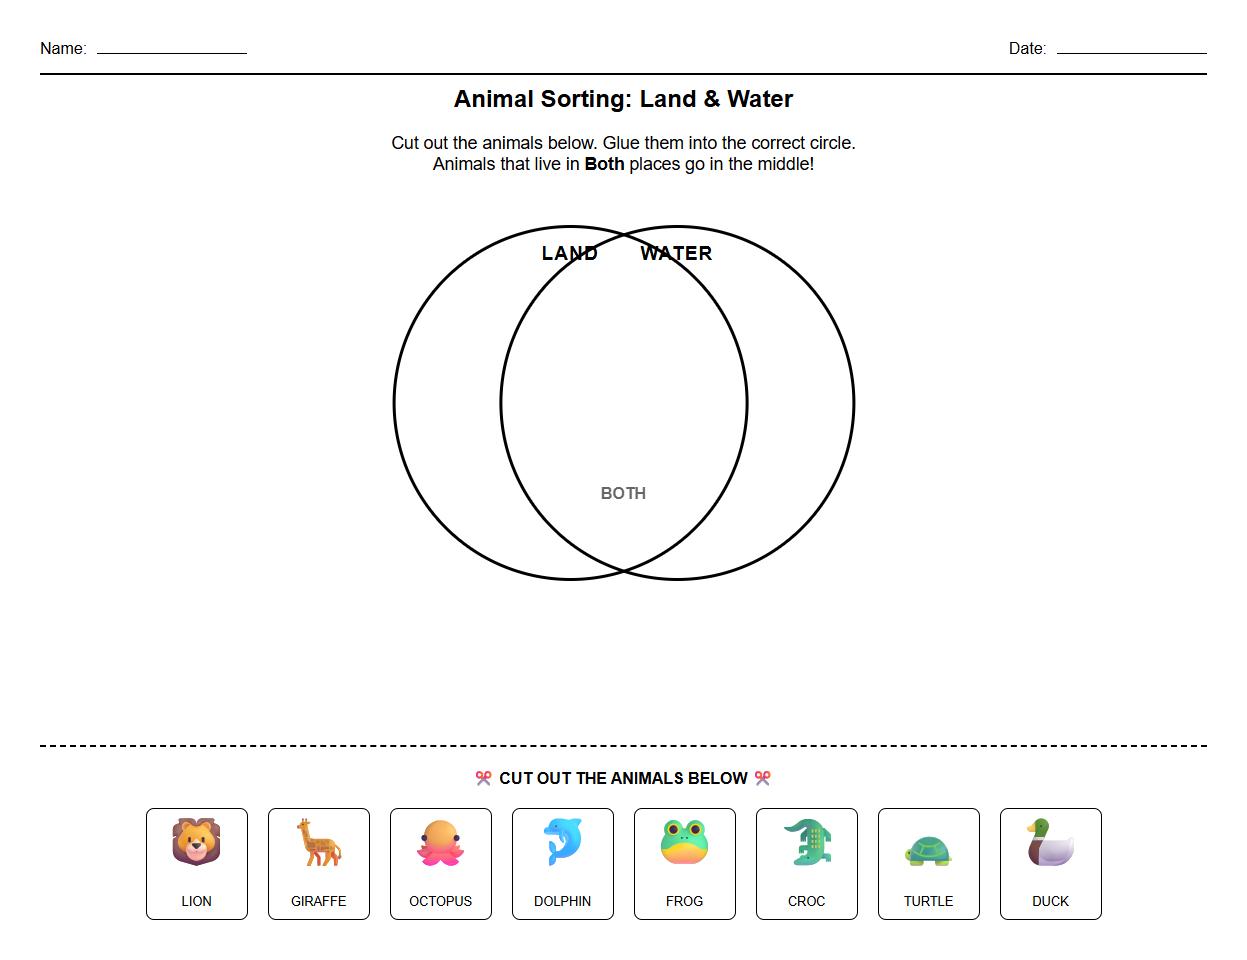
Venn Diagram Animal Grouping Worksheet

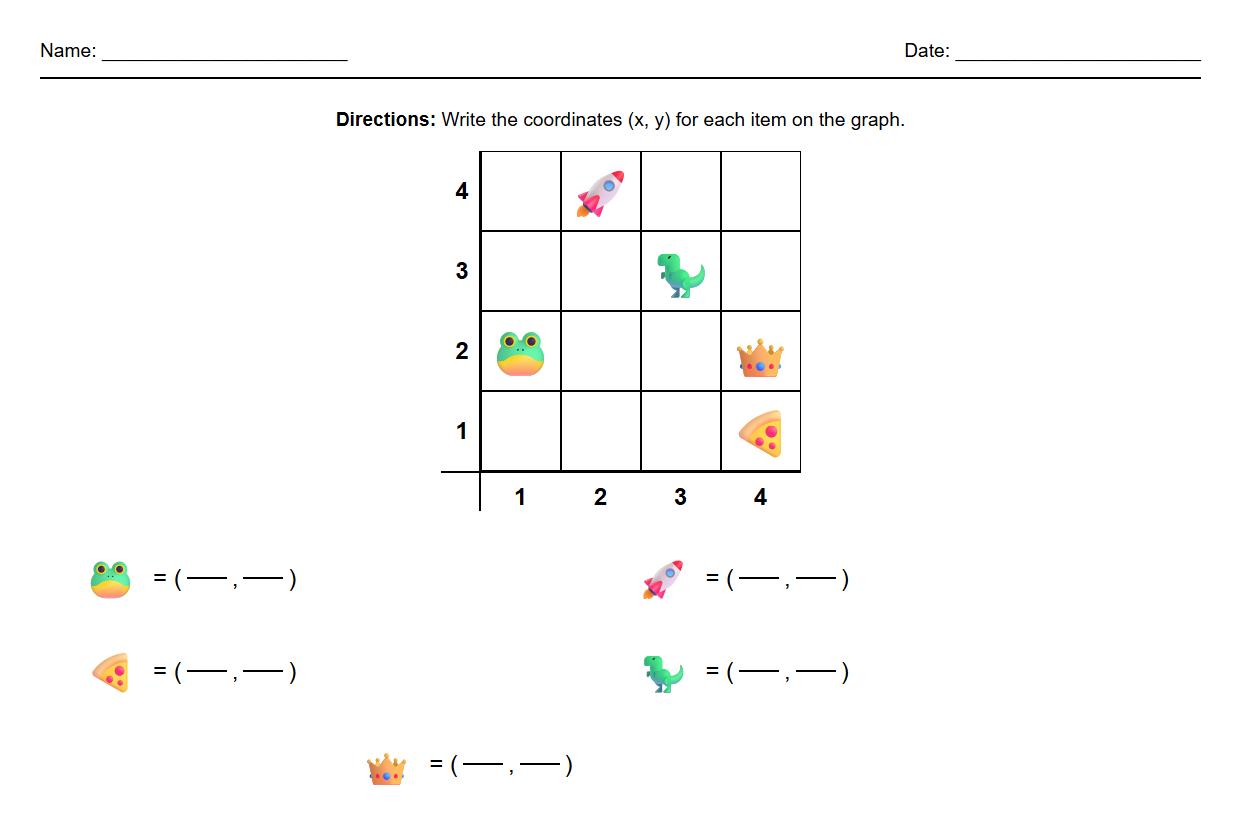
XY Axis Beginning Graphing Worksheet

Coordinate Grid Phonics Word Placement Worksheet
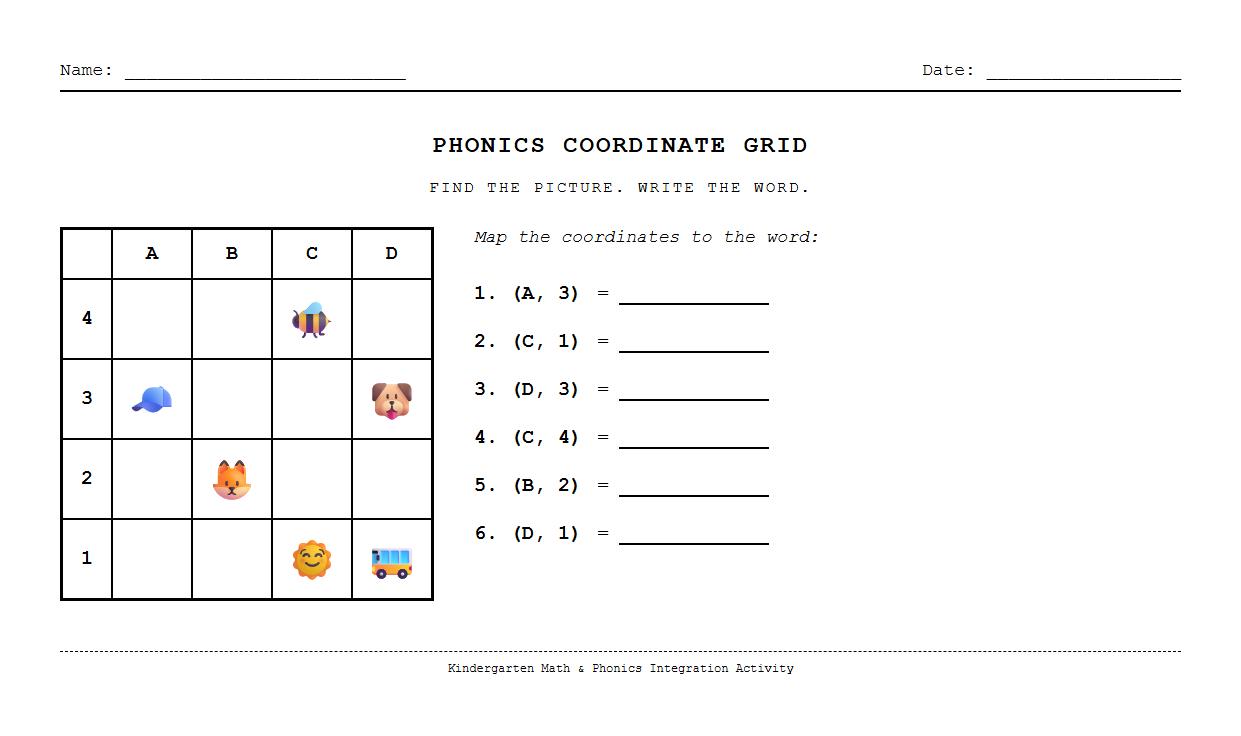

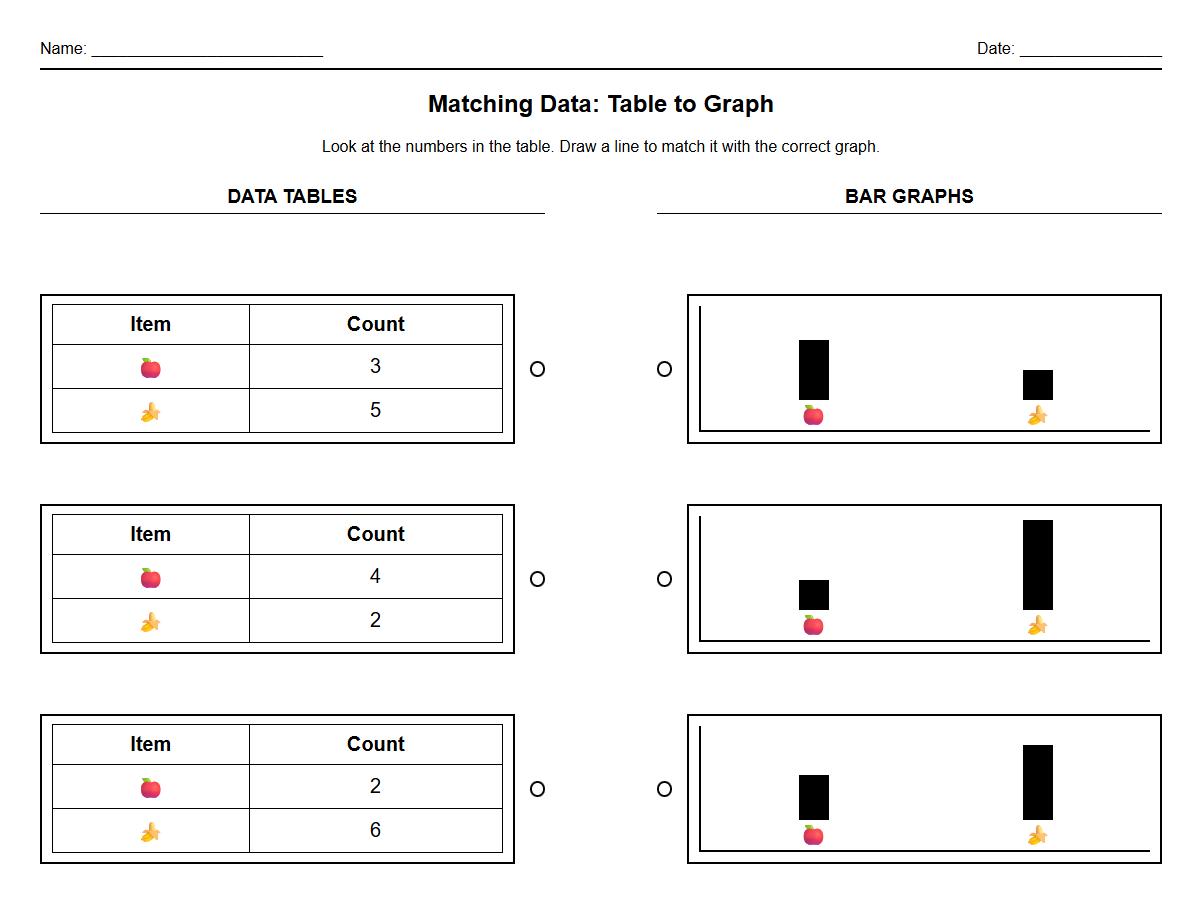
Table Data to Bar Graph Matching Worksheet

Survey Results Blank Data Chart Worksheet

 Kindergarten Tally Mark Activities for Data Collection