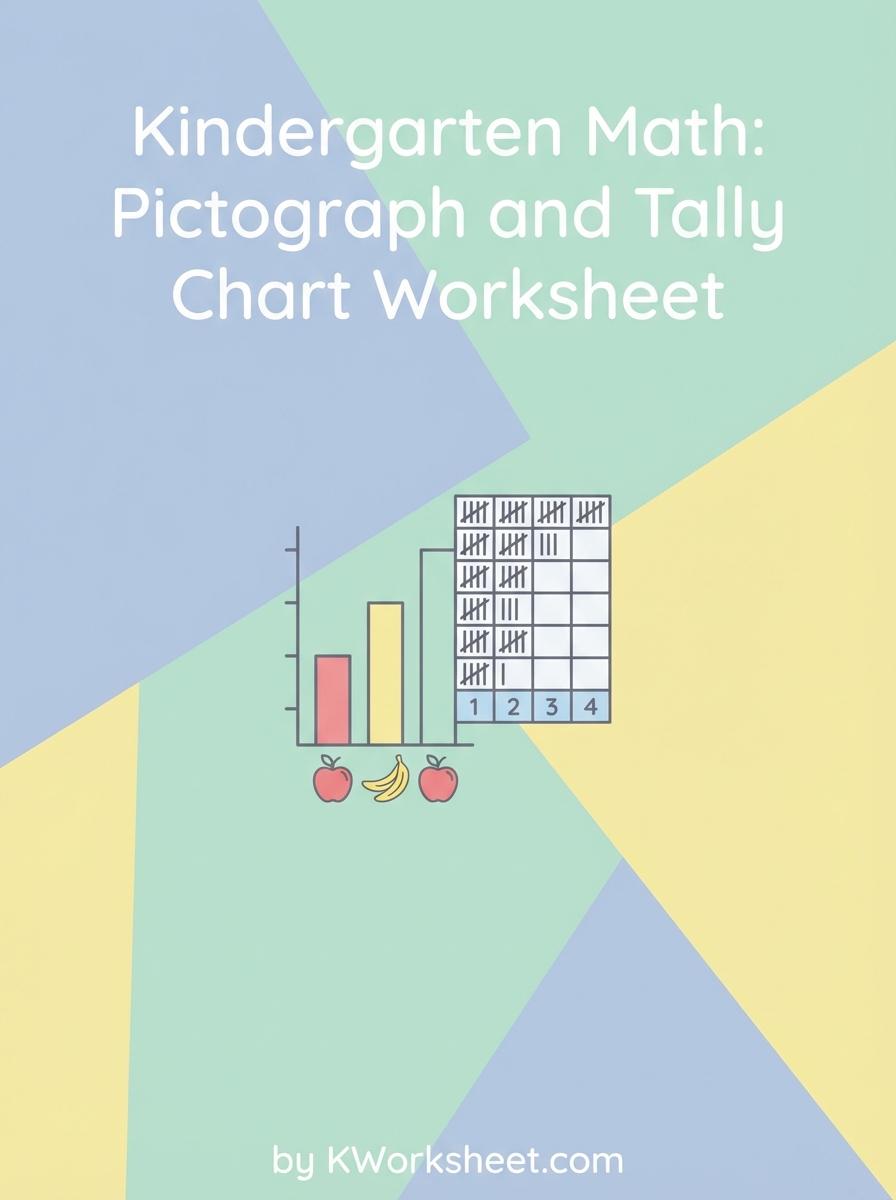

Kindergarten students develop early data interpretation skills through engaging with pictographs and tally charts, learning to recognize and represent quantities visually. These activities build a foundation in counting, comparing, and analyzing information using simple symbols and marks. Explore our collection of kindergarten math worksheets to support your child's understanding of pictographs and tally charts.
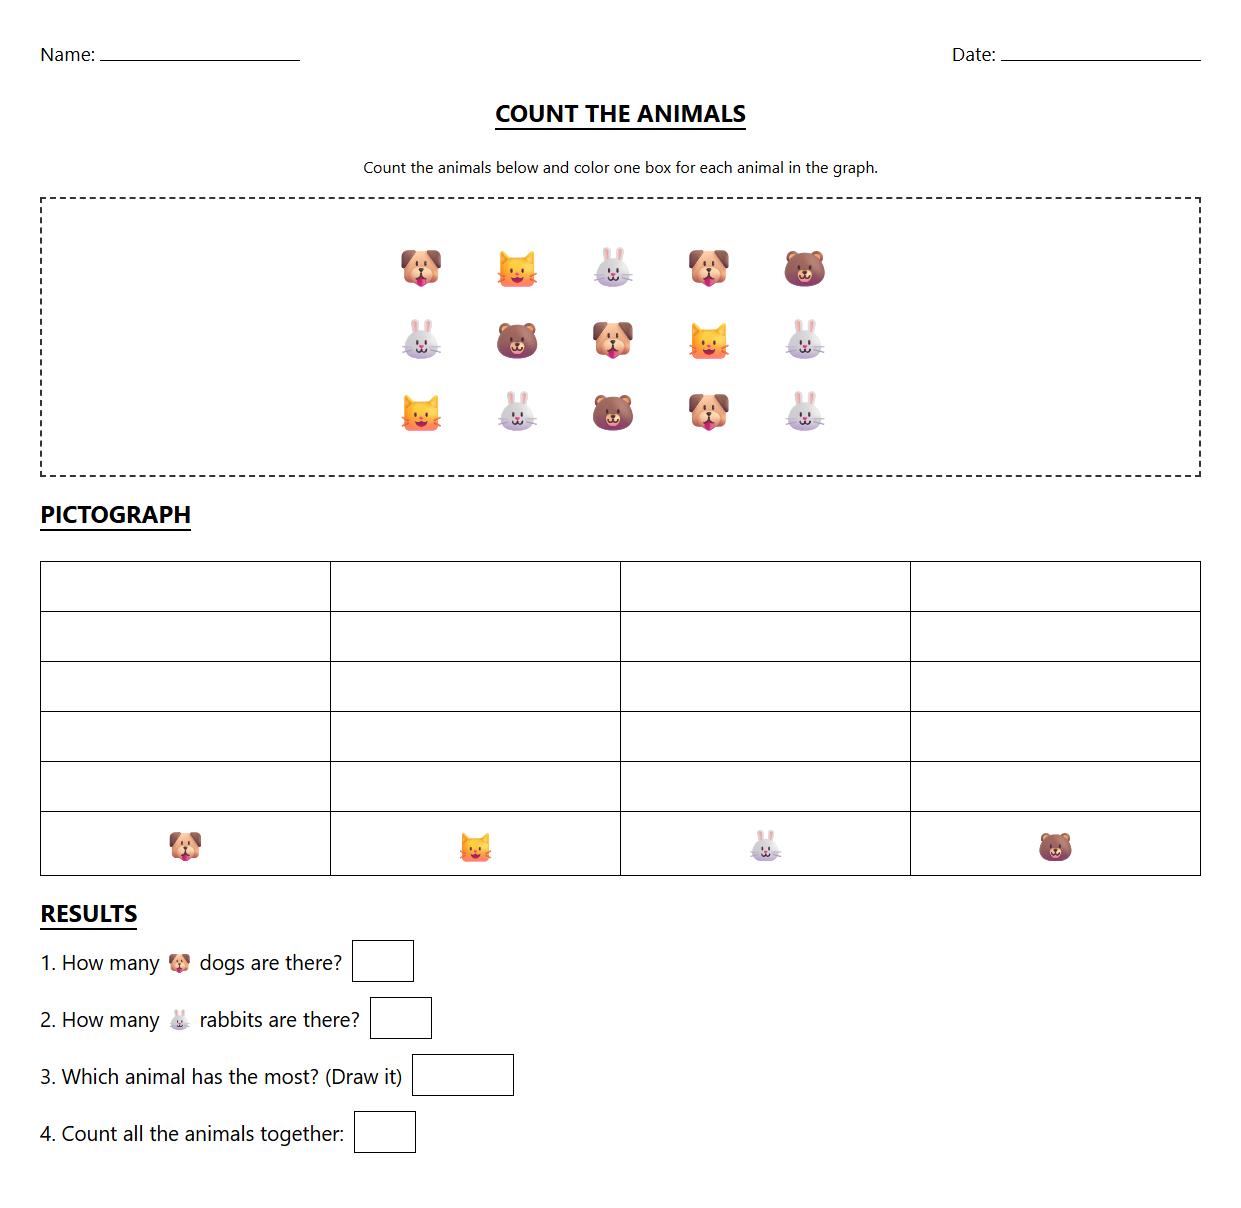
Pictograph worksheet with animal counting and symbol representation


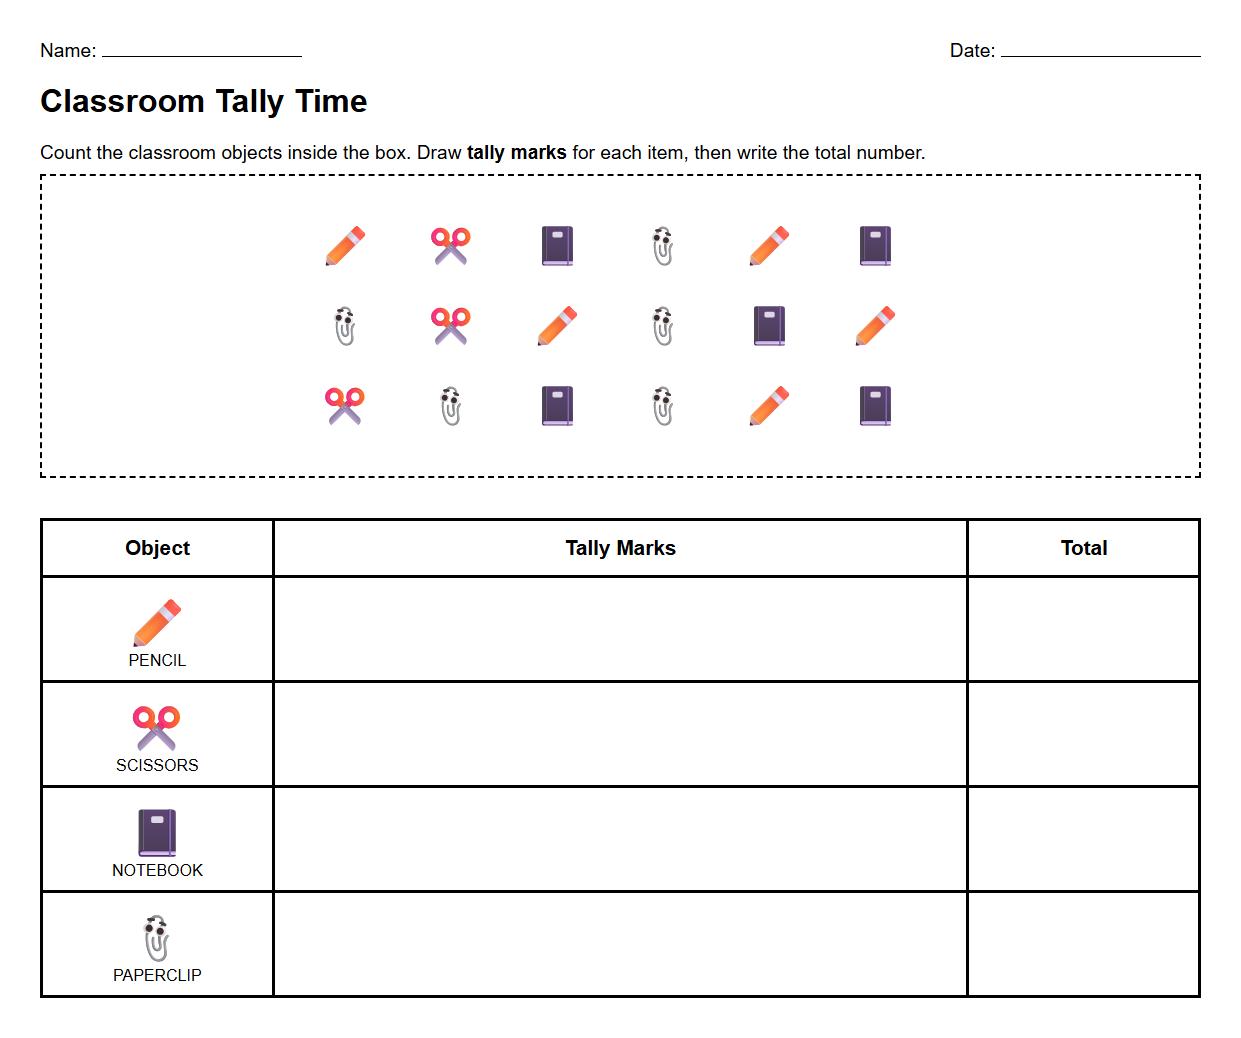
Tally chart worksheet using classroom objects for quantitative analysis

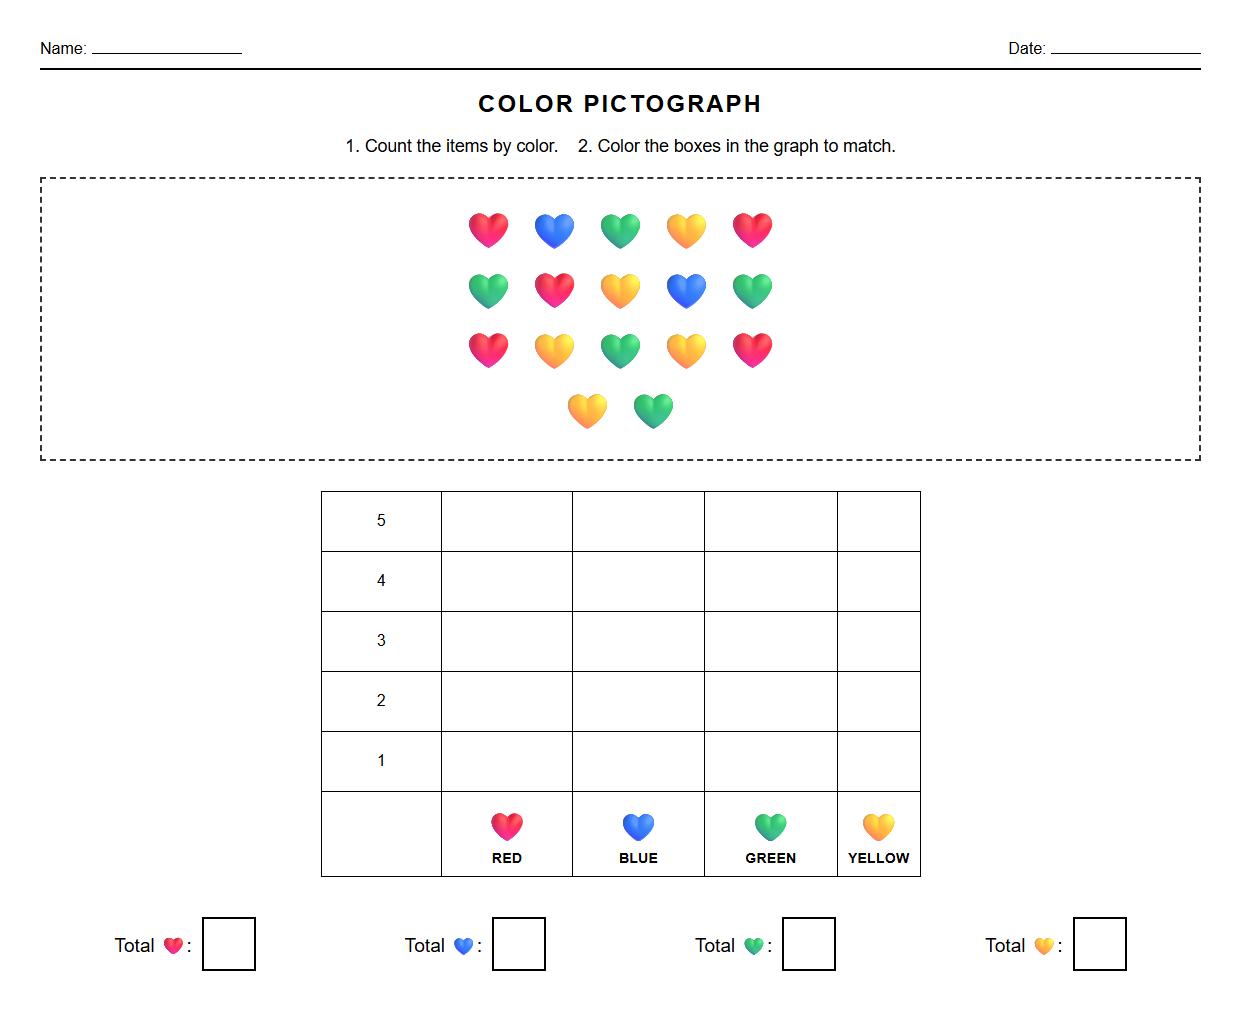
Pictograph worksheet focusing on color recognition and data visualization

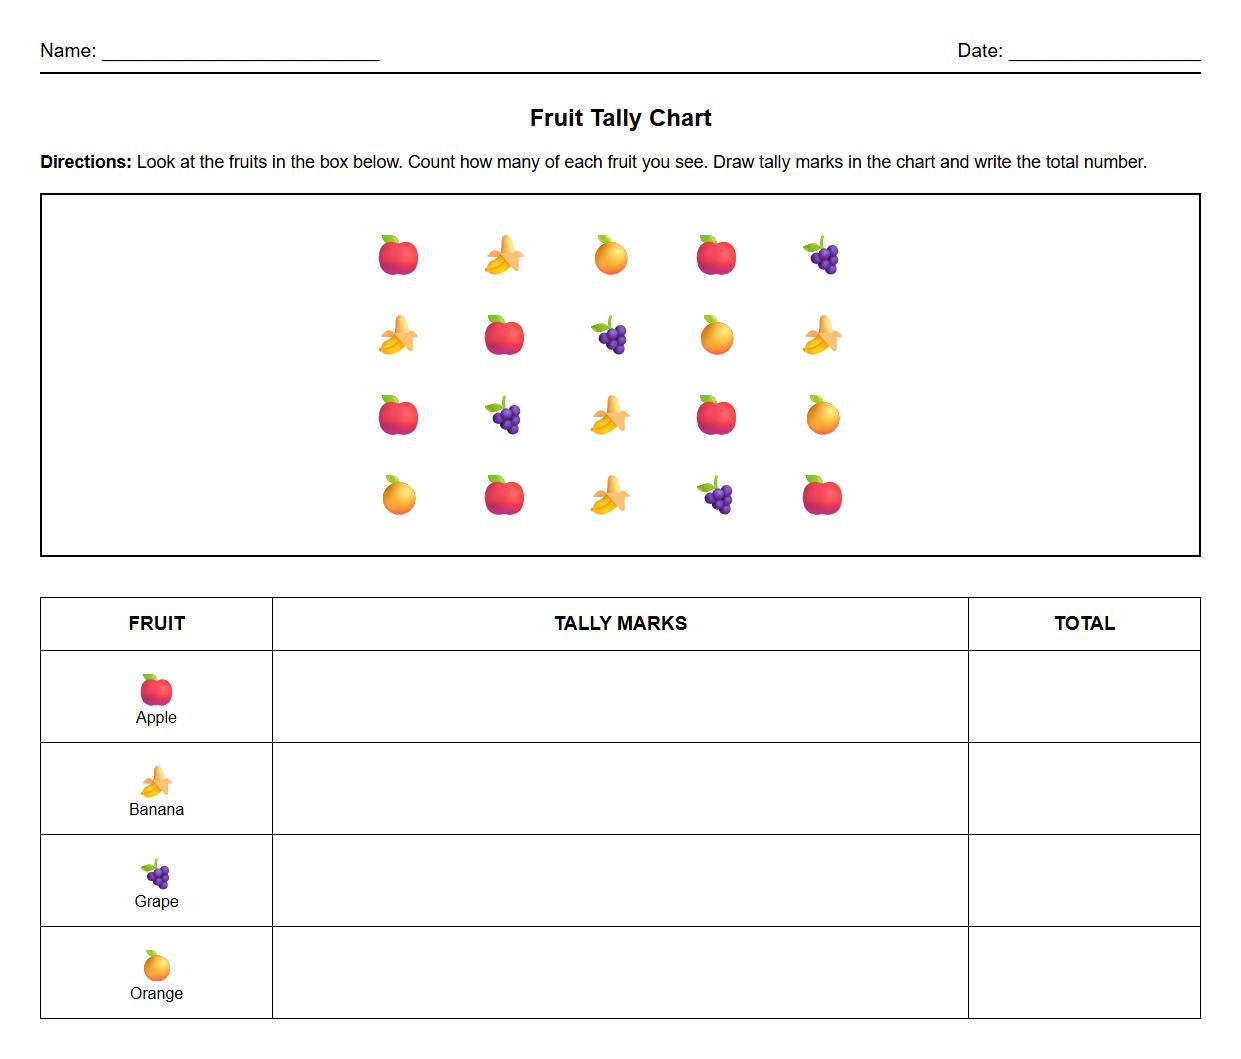
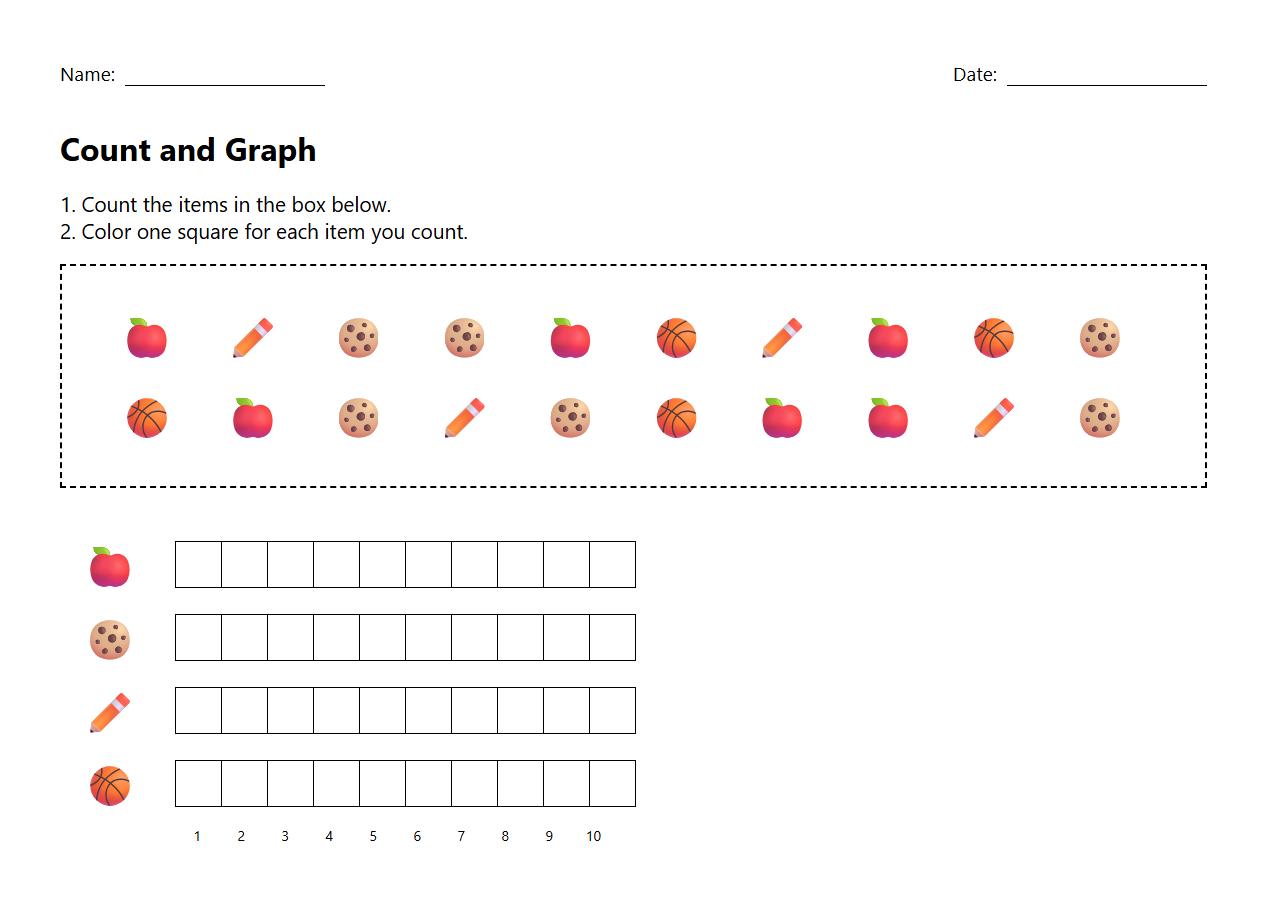
Tally chart worksheet with fruit images for counting and recording observations

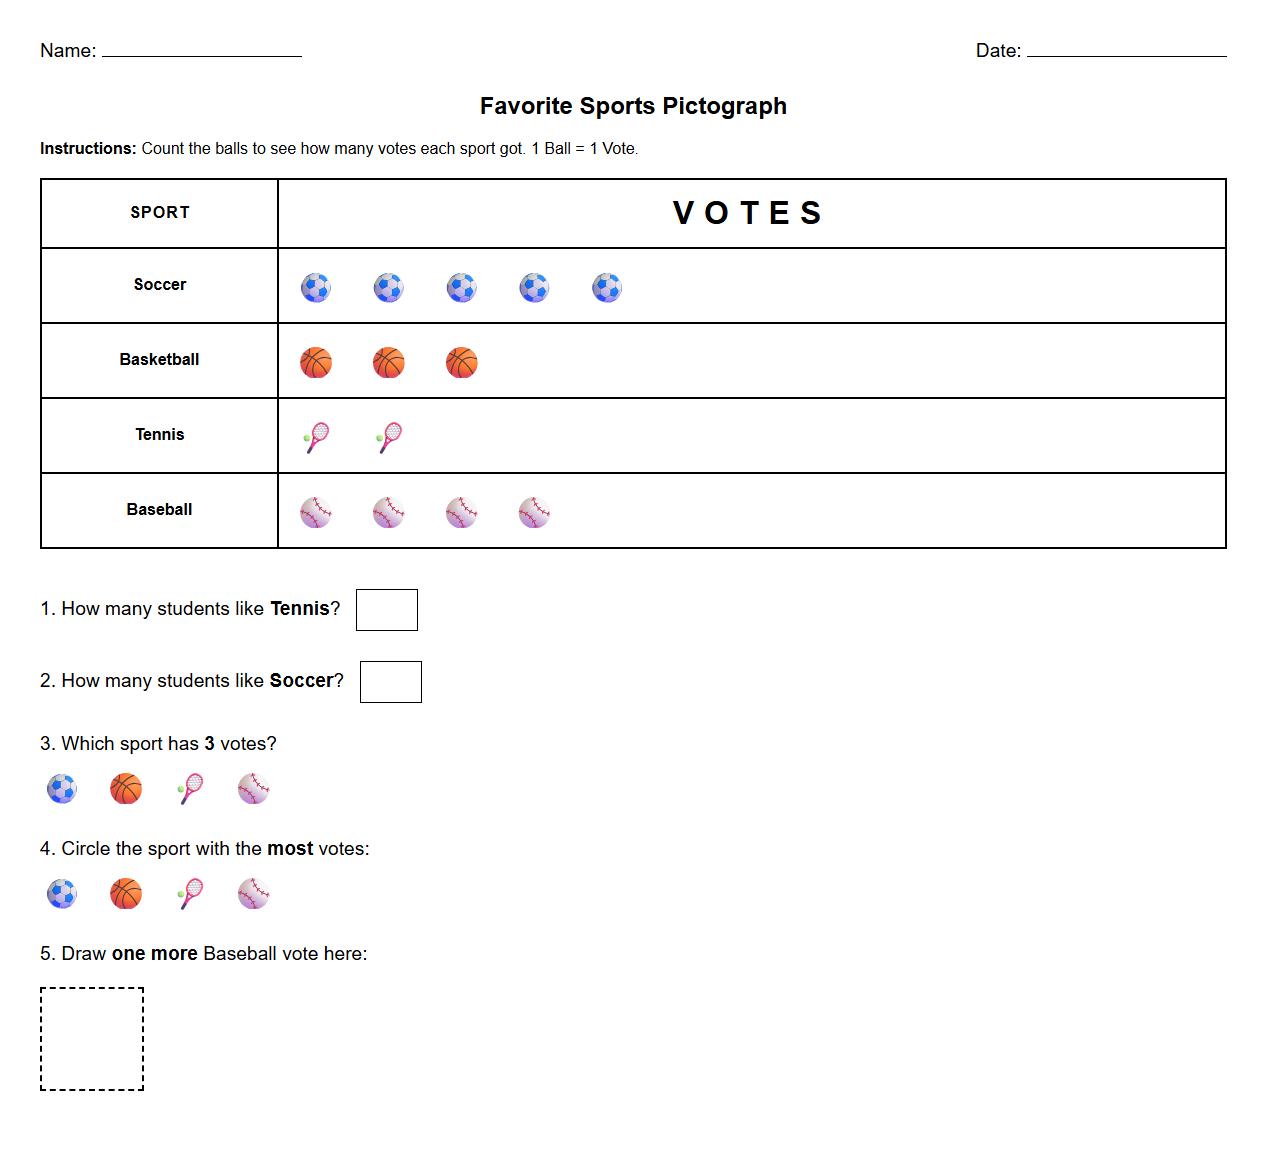
Comparative pictograph worksheet on favorite sports using visual data encoding

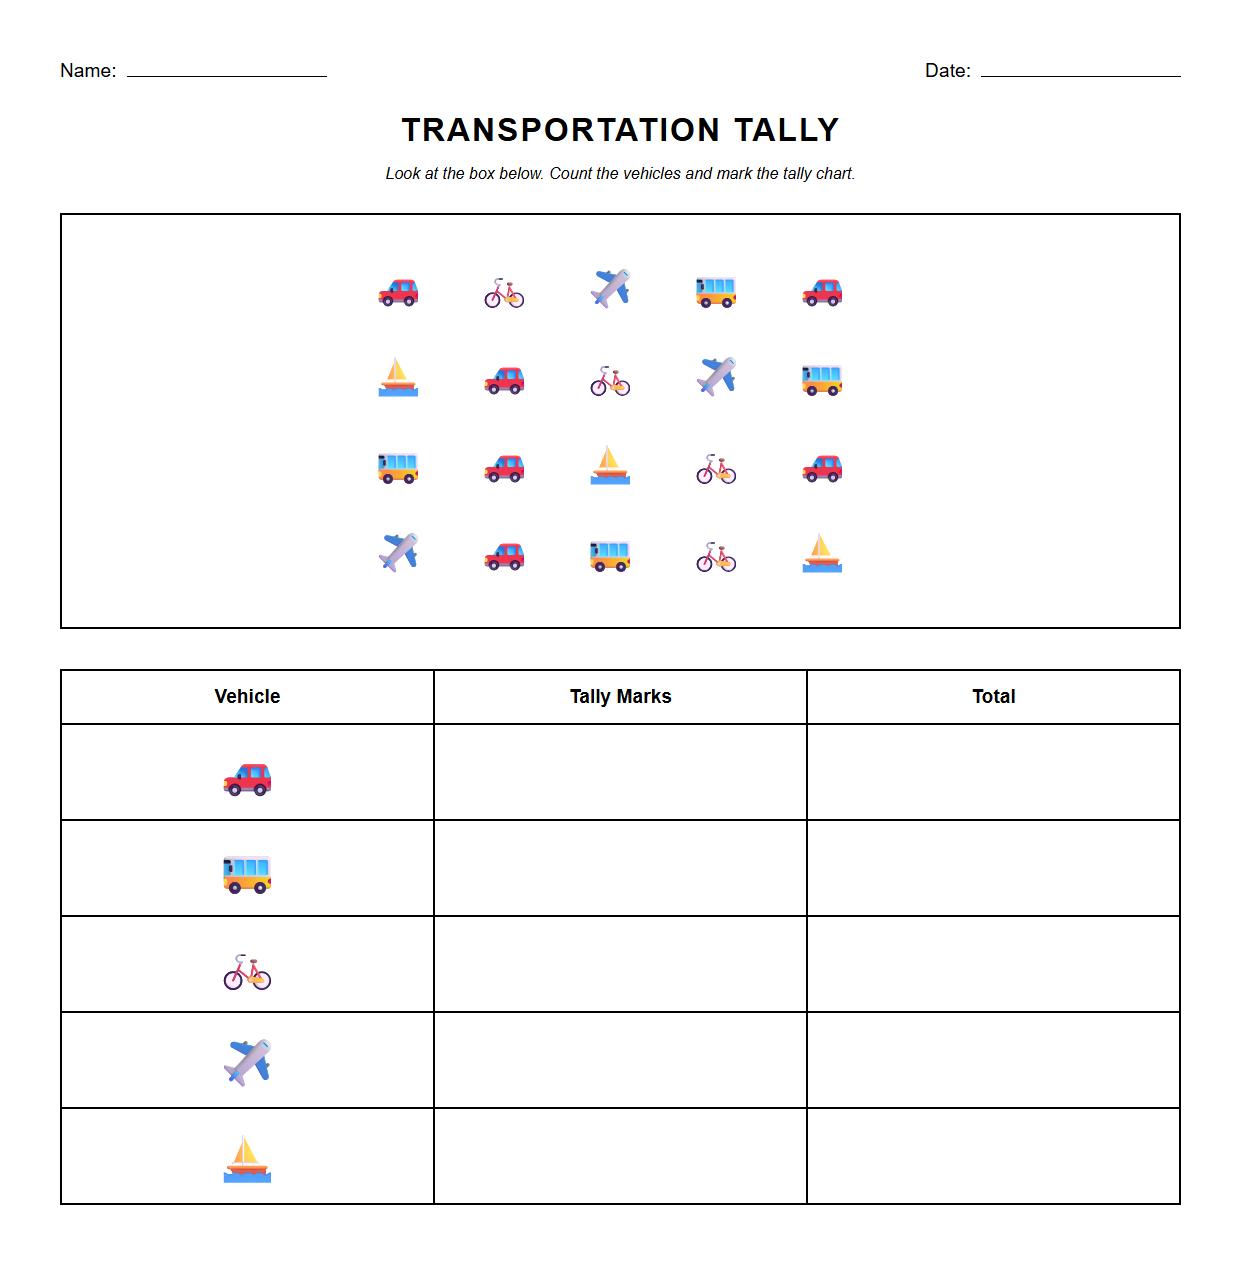
Tally chart worksheet featuring transportation modes for counting accuracy

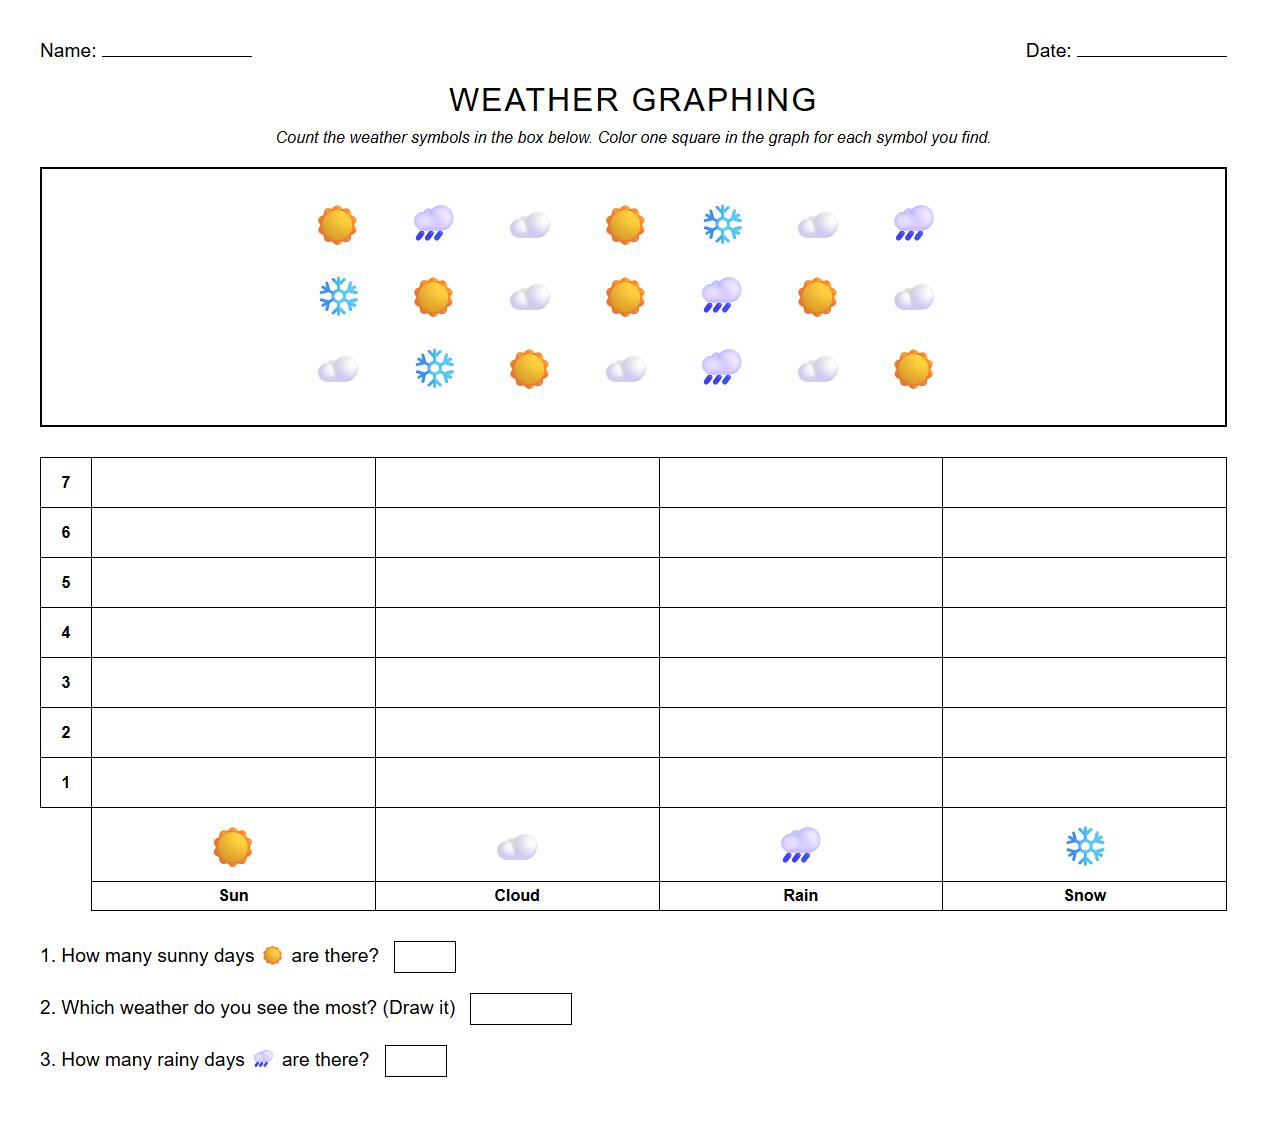
Pictograph worksheet integrating weather symbols for graphical data interpretation

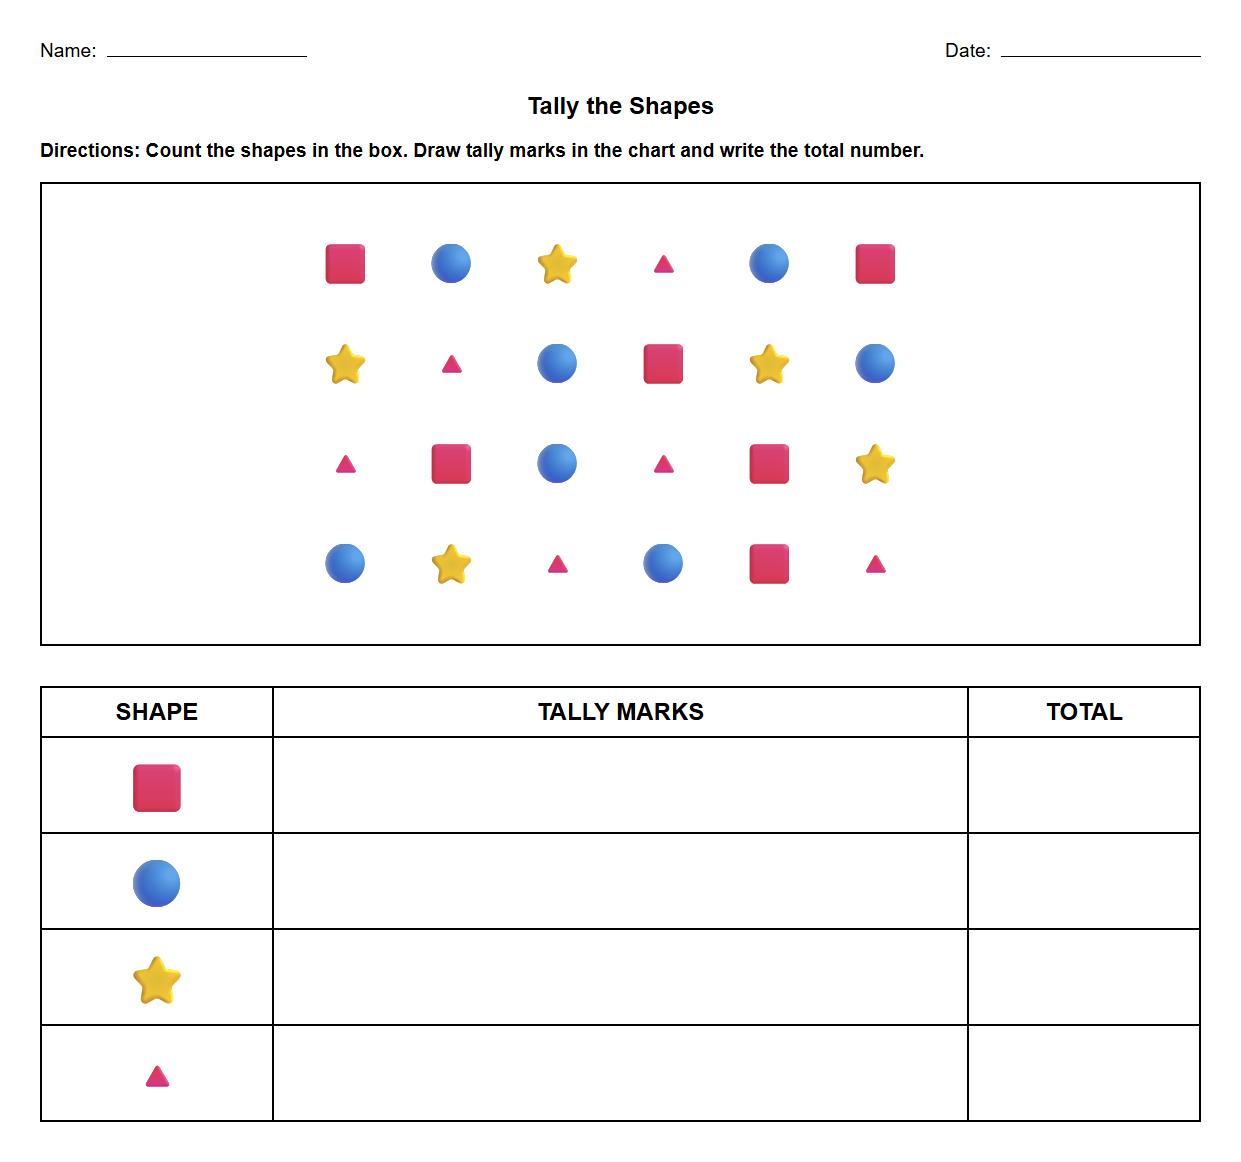
Tally chart worksheet using shapes for practicing one to one correspondence

Pictograph worksheet about number sense with everyday items

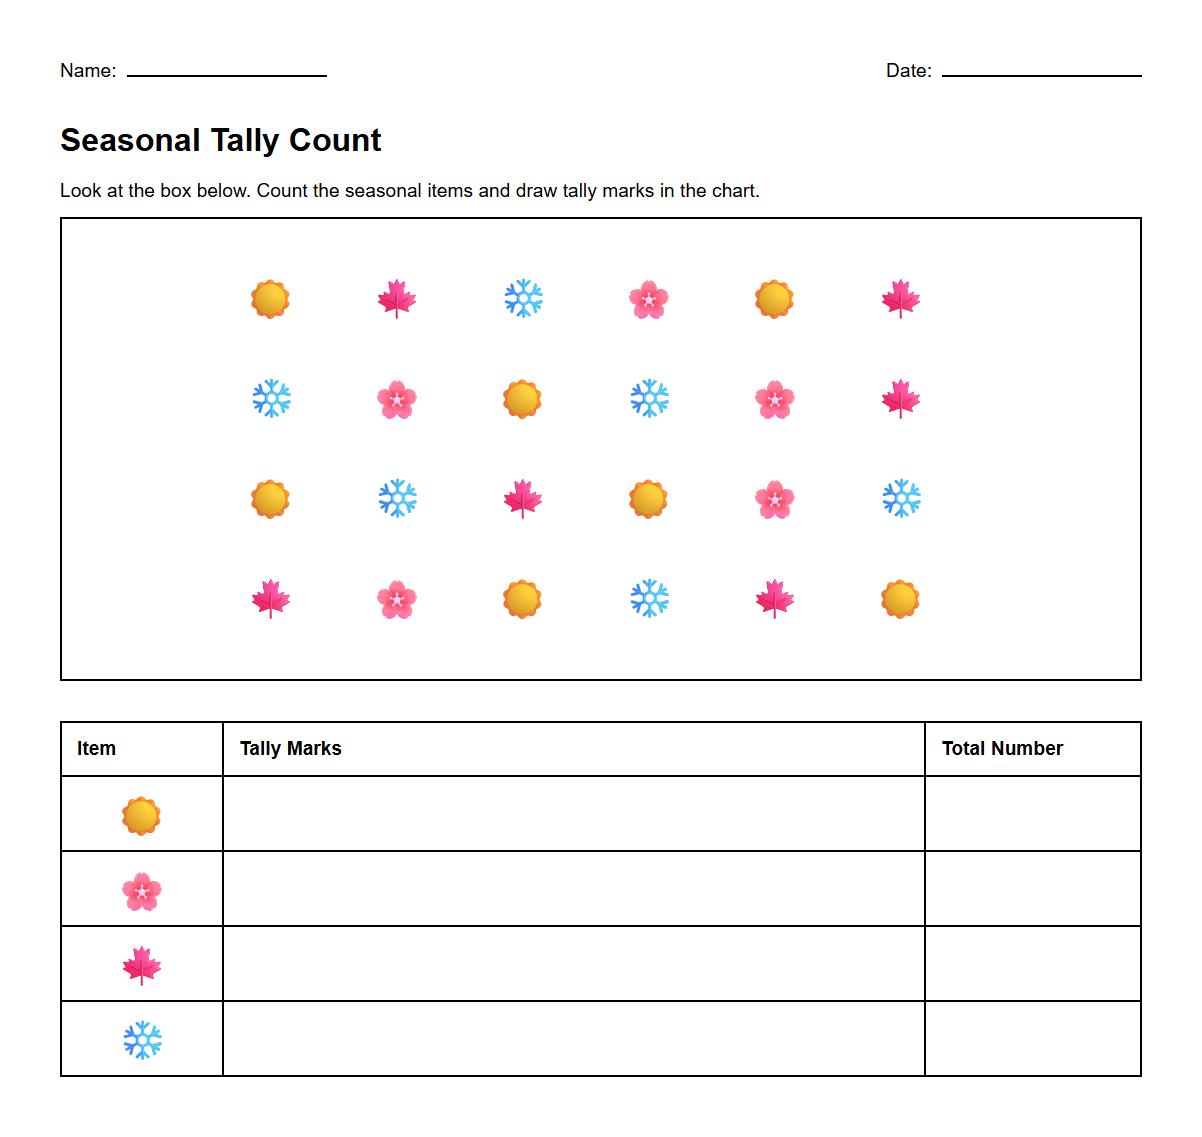
Tally chart worksheet applying quantitative data collection with seasonal themes

 Tally Marks to Bar Graph Activity Worksheet for Kids